By: Bitcoin Magazine Pro Team
Compiled by: BitpushNews
After breaking through $100,000 to set a new all-time high, Bitcoin has entered a sustained downward trend. This price correction naturally raises questions in the market about whether Bitcoin is still following the 2017 cycle. This article will evaluate the correlation between the current Bitcoin price trend and the historical bull market cycle through data analysis, and look forward to the possible development path of BTC in the future.
Will the trend of 2017 be replicated?
Since the 2022 bear cycle low, Bitcoin’s price trajectory has shown striking similarities to the 2015-2017 cycle, the historic bull run that culminated in $20,000 in December 2017.
However, the recent downward trend of Bitcoin marks the first time that its trend has significantly deviated from the 2017 cycle. If the 2017 pattern had been strictly followed, the past month should have been a period of rising for Bitcoin to set new highs, but the actual market has shown a sideways and downward trend, suggesting that the correlation between the two cycles may be weakening.
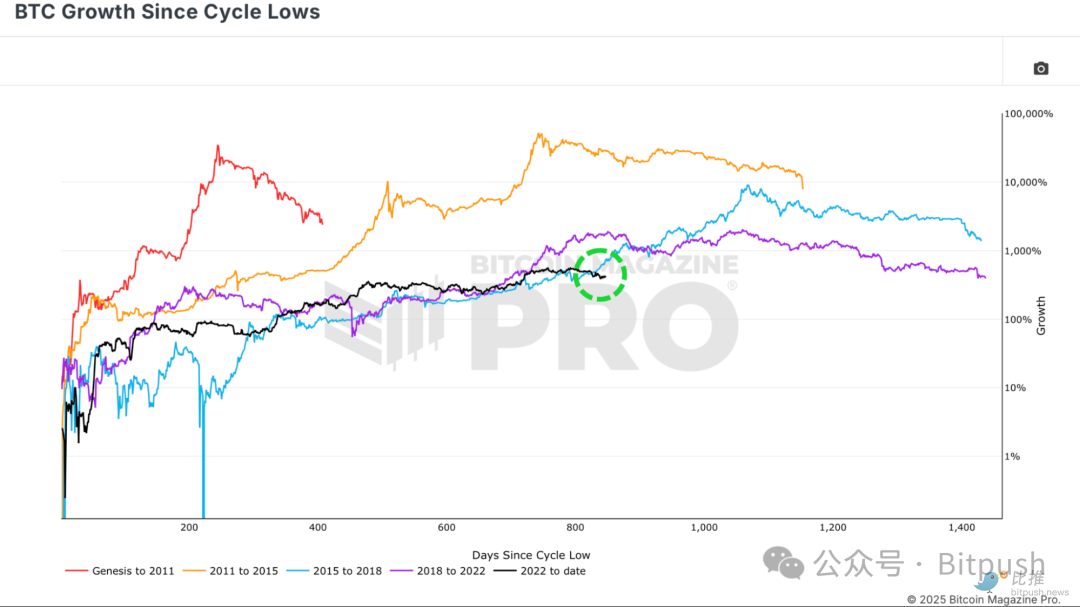
Figure 1: The current cycle trend trajectory has recently deviated from historical patterns
Despite the recent divergence, the historical correlation between the current Bitcoin cycle and the 2017 cycle remains unusually high. Earlier this year, the current cycle was about 92% correlated with the 2015-2017 cycle. The recent price divergence has slightly reduced the correlation to 91%, which is still extremely high in financial markets.
Investor behavior analysis
The MVRV ratio (market value to realized value ratio) is a key indicator for observing investor behavior. It is used to measure the relationship between the current market price of Bitcoin and the average cost price of all BTC holders on the chain.
When the MVRV ratio rises sharply, it indicates that investors' paper profits have significantly expanded, which often indicates that the market top has formed; and when the ratio falls back to the realized price, it means that the Bitcoin price is close to the average holding cost of investors, which usually indicates that the market has entered the bottoming stage.
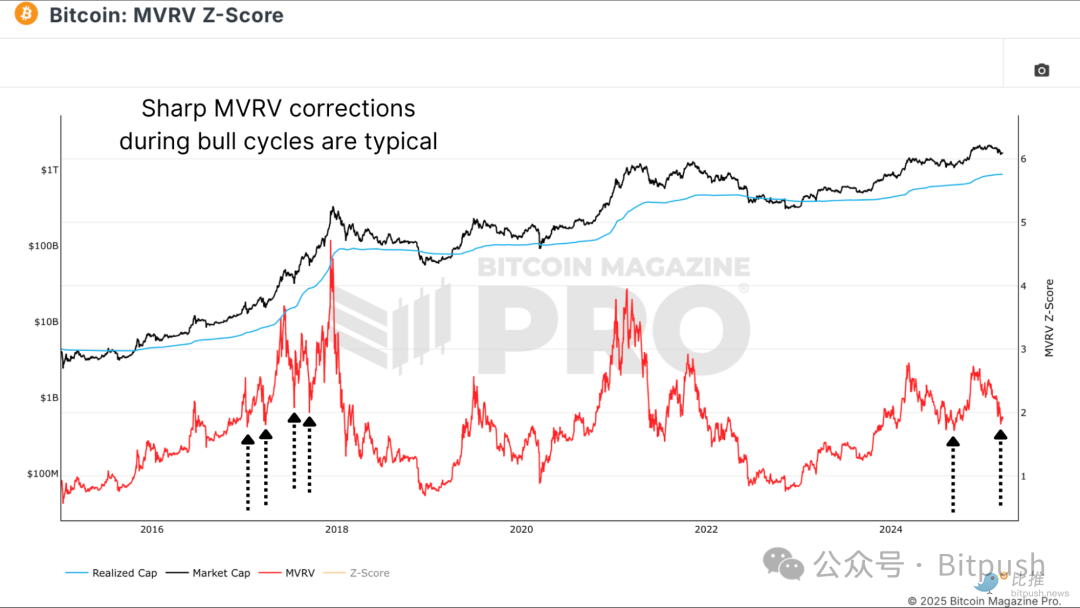
Figure 2: The MVRV ratio still maintains a similar fluctuation pattern to the 2017 cycle
Recent Developments in the MVRV Ratio
The recent decline in the MVRV ratio reflects Bitcoin’s current correction from its all-time highs, but its overall structure still bears similarities to the 2017 cycle – the early bull run was followed by several deep corrections, so the correlation between the two remains at 80%.
Data lag effect
One possible reason for the current divergence in trends is the impact of data lags. For example, Bitcoin price movements are highly correlated with global liquidity (the total money supply of major economies), but historical data shows that changes in liquidity usually take about two months to be reflected in Bitcoin prices.
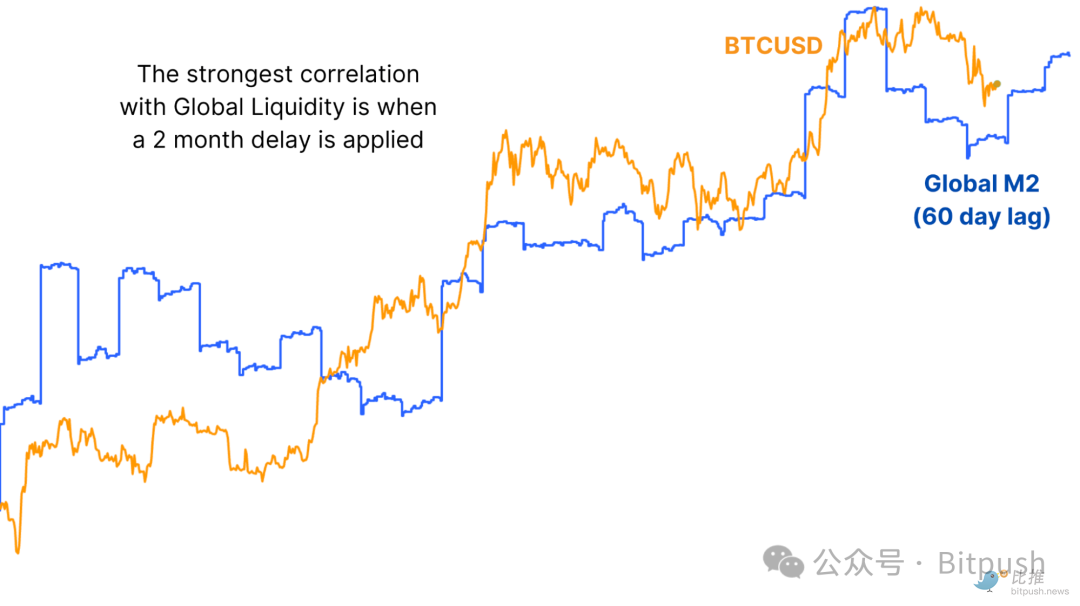
Figure 3: Global M2 money supply has a lagged transmission effect on Bitcoin prices
Hysteresis effect verification
If the current Bitcoin price trend is lagged by 30 days with the 2017 cycle, the correlation between the two will rise to 93%, becoming the highest correlation value ever recorded between the two cycles. This lagged trend pattern suggests that Bitcoin may soon return to the 2017 trajectory, which means that a strong upward trend may be coming.
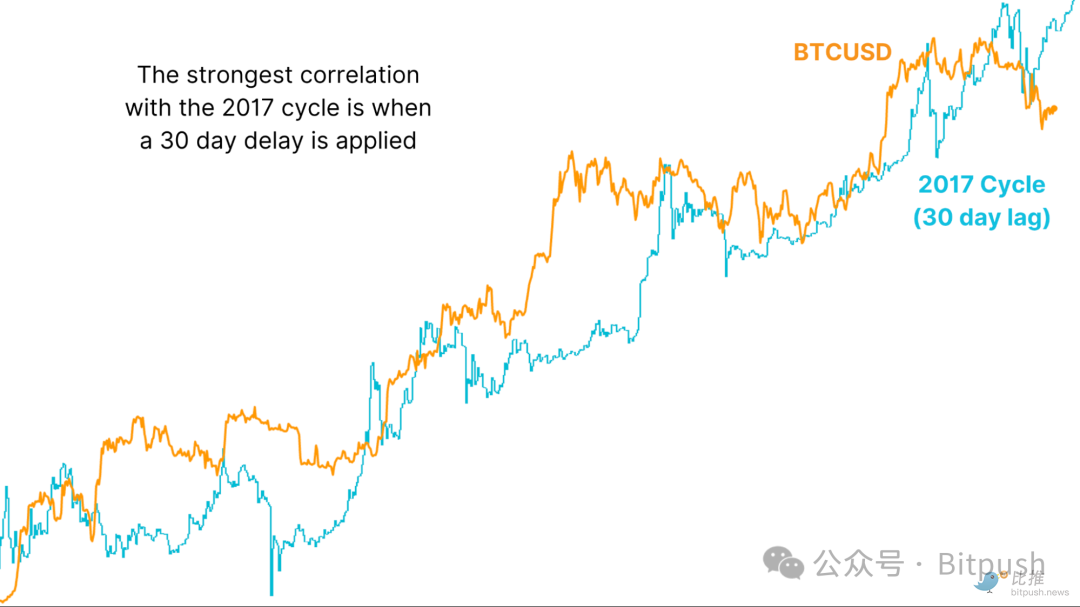
Figure 4: Price trends after 30-day lag are still highly consistent with 2017 data
Core conclusion
History will not simply repeat itself, but it often has similar rhymes. The current Bitcoin cycle may not be able to replicate the exponential surge of 2017, but the deep psychological mechanism of the market still shows amazing similarities. If Bitcoin reconnects with the lagging 2017 cycle, historical laws show that Bitcoin may soon recover from the current adjustment and usher in a breakthrough rise.