By Carol, PANews
On January 11, the decade-long Bitcoin spot ETF was finally settled. The U.S. Securities and Exchange Commission (SEC) officially approved 11 Bitcoin spot ETFs, including iShares Bitcoin Trust, Fidelity Wise Origin Bitcoin Fund, and Bitwise Bitcoin ETF.
The mainstream market view is that the listing of Bitcoin spot ETF is expected to open up institutional channels, attract more funds, and promote the rapid expansion of the crypto economy. Simply put, Bitcoin spot ETF is expected to drive up Bitcoin prices and return to a full bull market. However, within a week after the opening of Bitcoin spot ETF (as of January 19), these ideal pictures have not yet appeared, and the price of Bitcoin has fallen back to around $41,000.
What is the basic situation of Bitcoin spot ETF? How did it perform in the first week of trading? What impact did it have on Bitcoin? PAData, a data column under PANews, analyzed the basic situation and trading situation of various ETFs and found that:
- As of January 19, the total assets under management (AUM) of the 11 Bitcoin spot ETFs was approximately $26.975 billion. The top three were Grayscale, $23.537 billion; iShares Bitcoin Trust, $1.199 billion; and Fidelity Wise Origin Bitcoin Fund, $1.017 billion. From January 11 to January 19, the AUM of the 11 Bitcoin spot ETFs fell by 8.41%.
- As of January 19, the eight ETFs that announced their holdings held a total of 635,700 BTC, of which Grayscale held about 567,000 BTC. Secondly, iShares Bitcoin Trust, Fidelity Wise Origin Bitcoin Fund, and Bitwise Bitcoin ETF also held relatively high amounts, about 28,600 BTC, 24,900 BTC, and 10,200 BTC, respectively.
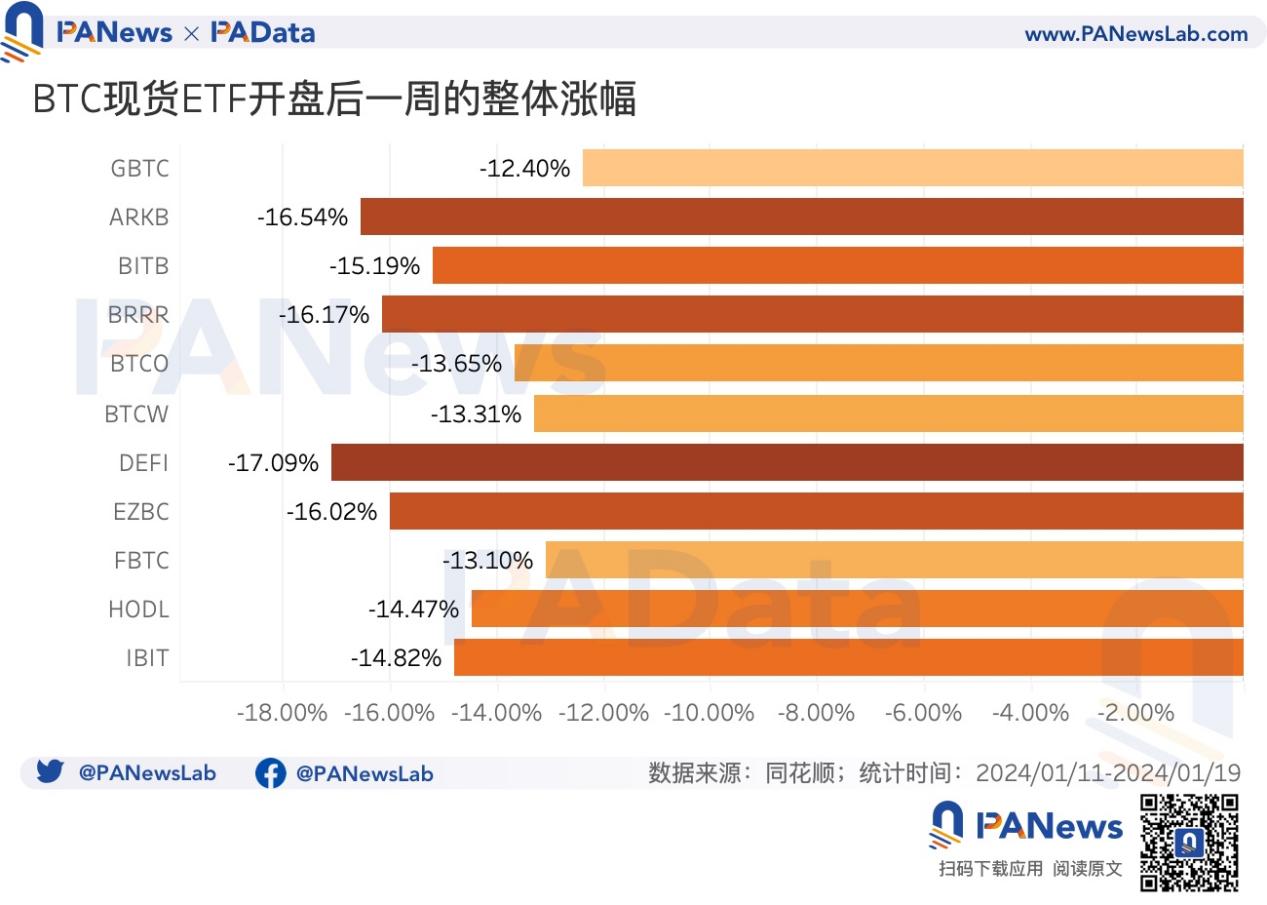
- Bitcoin spot ETFs have seen a general decline since their opening. Based on the increase in the closing price on the 19th compared to the opening price on the 11th, the market prices of the 11 ETFs have fallen by an average of 14.80%.
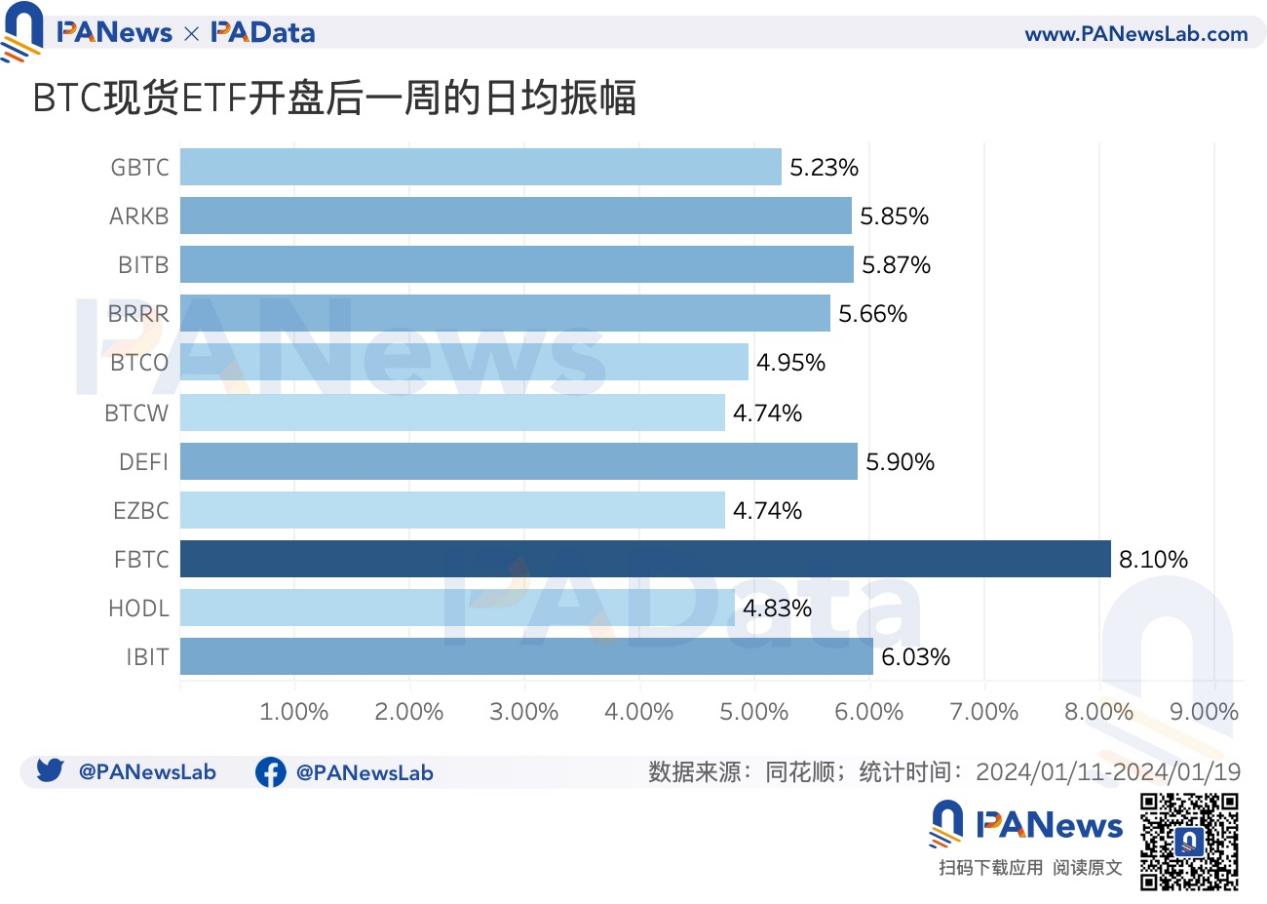
- The price fluctuation of Bitcoin spot ETF is quite obvious. The average daily fluctuation of the market price of 11 ETFs is about 5.63%, which is higher than the 4.78% of Bitcoin in the same period.
- Among the 11 Bitcoin spot ETFs, 5 are at a discount, with BRRR having the highest discount at 0.51% and GBTC having the lowest discount at about 0.27%. The space for arbitrage activities based on the GBTC discount rate has been further reduced, and it is expected that the impact of these arbitrage activities on market selling pressure will be limited in the future.
- The total transaction volume of Bitcoin spot ETF within 6 days after its listing was about 16.691 billion US dollars. Among them, GBTC is the ETF with the largest transaction volume, with a total transaction volume of 9.012 billion US dollars in 6 days, followed by IBIT and FBTC, which reached 3.194 billion US dollars and 2.649 billion US dollars respectively.
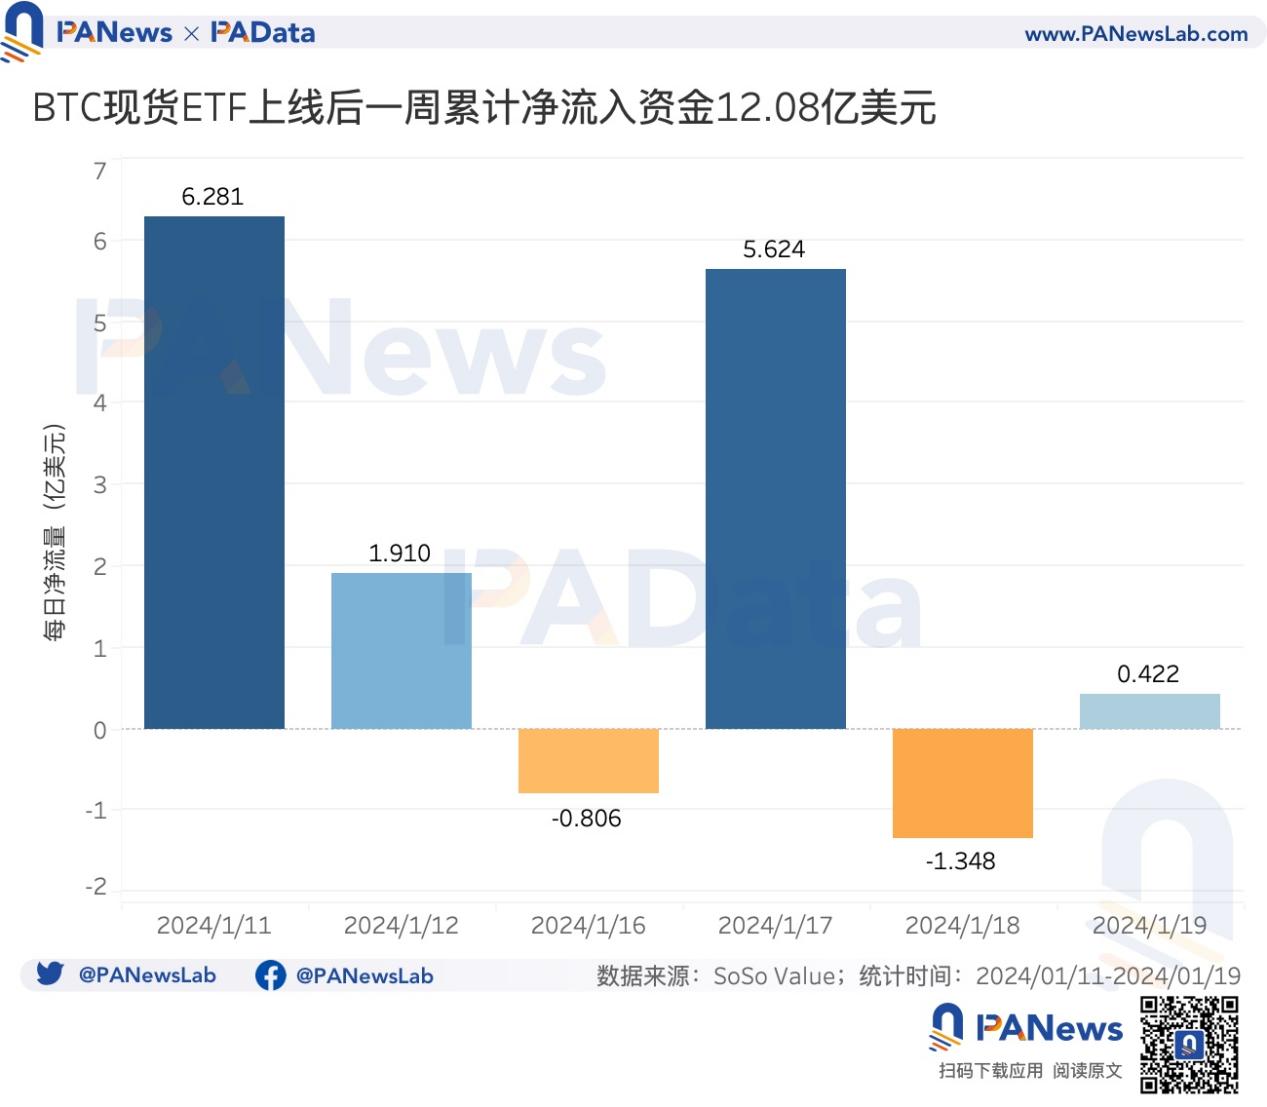
- The Bitcoin spot ETF received a total net inflow of approximately $1.208 billion in the six days after its listing, of which $628 million was net inflow on the first day. Although the spot ETF has injected new funds into the crypto market, it is still far from driving a new round of "institutional bull market".
- Investors in the United States are very optimistic about the approval and listing of Bitcoin spot ETFs, but in contrast, investors in Asia are the opposite.
- The Bitcoin market has recently shown some positive characteristics. First, the market purchasing power has increased; second, the transaction activity on the Bitcoin chain has increased; and third, more Bitcoins are being accumulated.
01. Total asset management scale exceeds US$26.9 billion, and 8 ETFs disclosed holdings of 635,700 BTC
According to the official website data of 11 issuers, combined with cross-validation of third-party data from Trading View and Robinhood, as of January 19, the total assets under management (AUM) of the 11 Bitcoin spot ETFs was approximately US$26.975 billion. Among them, Grayscale alone had an AUM of US$23.537 billion, accounting for 87.25% of the total. Secondly, iShares Bitcoin Trust and Fidelity Wise Origin Bitcoin Fund also had AUM exceeding US$1 billion, while the AUM of other spot ETFs is still relatively small, less than US$500 million, and some less than US$100 million.
According to the AUM data compiled by SoSo Value, the AUM on January 11 was approximately US$29.38 billion, but by January 19 it had dropped to US$26.91 billion, with an overall decrease of approximately 8.41%.
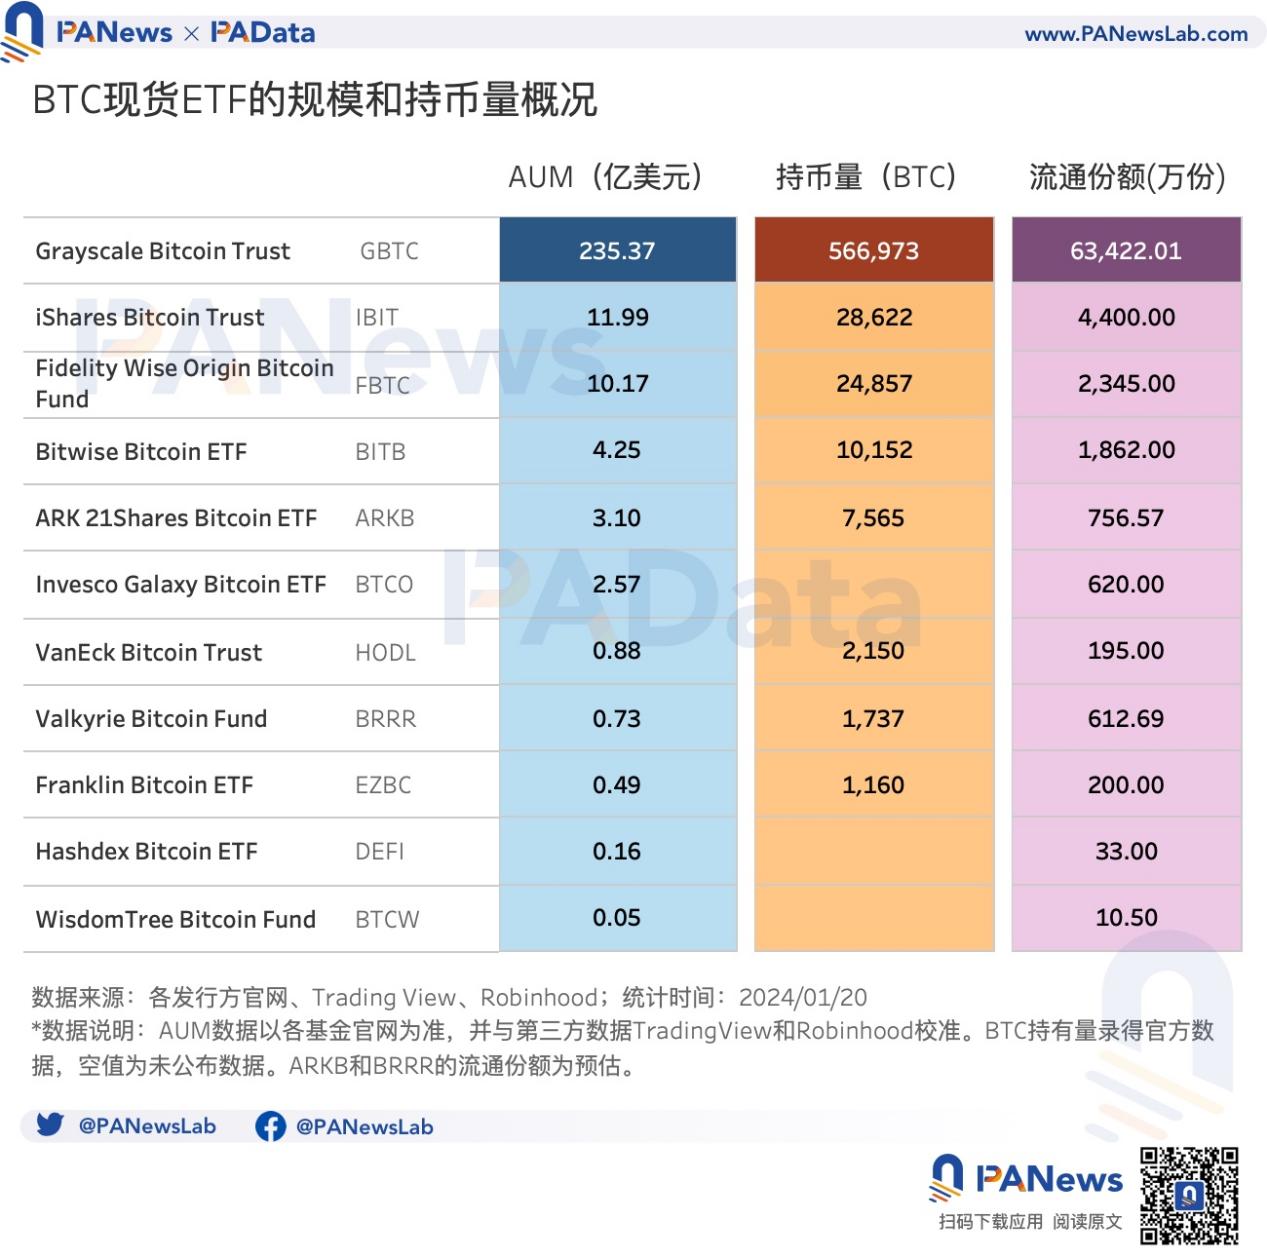
Eight of the 11 Bitcoin spot ETF issuers have announced their Bitcoin holdings. As of January 19, these eight ETFs held a total of 635,700 BTC, of which Grayscale held about 567,000 BTC, accounting for about 89.20% of the total. Secondly, iShares Bitcoin Trust, Fidelity Wise Origin Bitcoin Fund and Bitwise Bitcoin ETF also have high holdings, about 28,600 BTC, 24,900 BTC and 10,200 BTC respectively.
Faced with the fierce competition of 11 Bitcoin spot ETFs listed at the same time, various institutions have adopted the strategy of reducing the management fee rate (Total Expense Ratio, TER) to compete for market funds. At present, 6 Bitcoin spot ETFs including FBTC, BITB, BTCO, etc. all implement a 0% management fee rate, but after the expiration of the preferential period, the management fee rate of these ETFs will generally rise to around 0.2%-0.3%, which is a level lower than the industry average management fee rate. However, unlike these ETFs, Grayscale, the largest in scale, still adopts an ultra-high management fee rate of 1.5%. In addition, the fee rate of Hashdex Bitcoin ETF is also relatively high, reaching 0.9%.
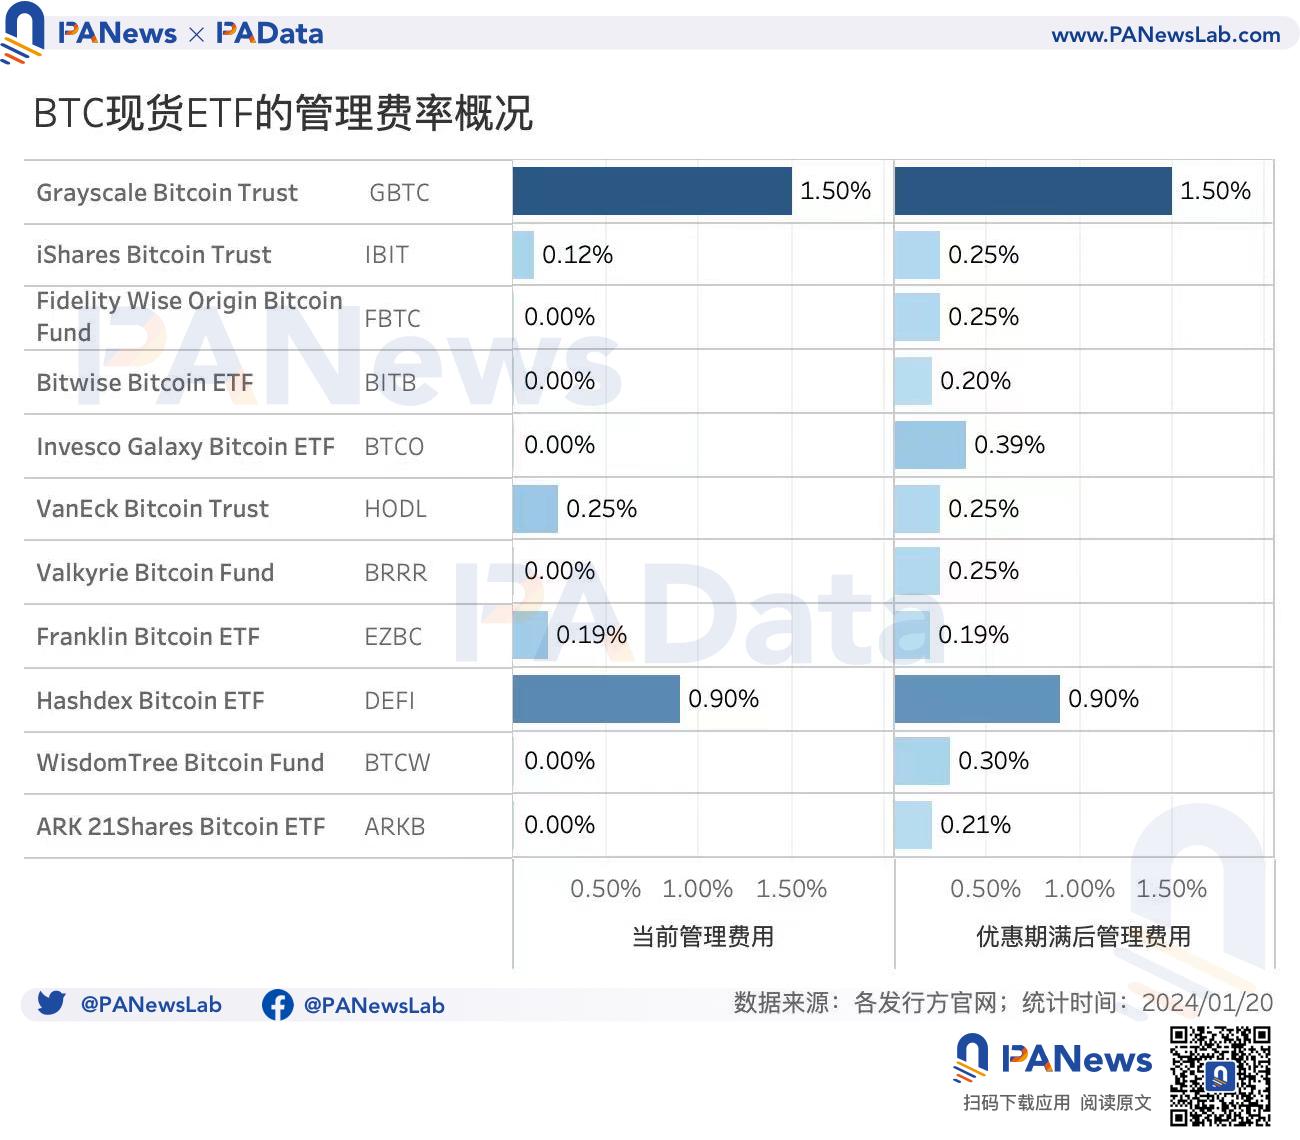
According to public reports, VanEck and Bitwise intend to donate 5% and 10% of the ETF profits to Bitcoin core developers respectively. According to the management fee rate and current asset management scale of the two ETFs after the expiration of the preferential period, the two donations will add up to about $96,100. If the Bitcoin spot ETF develops smoothly, the asset management scale of these two ETFs will increase significantly, and the donation amount will also increase accordingly.
02. The total transaction volume in the first 6 days after the opening exceeded 16.6 billion US dollars, and the cumulative net inflow of funds exceeded 1.2 billion US dollars
Since the opening of Bitcoin spot ETFs, there has been a general decline. Based on the increase in the closing price on the 19th compared with the opening price on the 11th, the market prices of the 11 ETFs have fallen by an average of 14.80%. Among them, the market price of DEFI fell the most, with a drop of more than 17%, and the market price of GBTC fell the least, with a drop of about 12%.
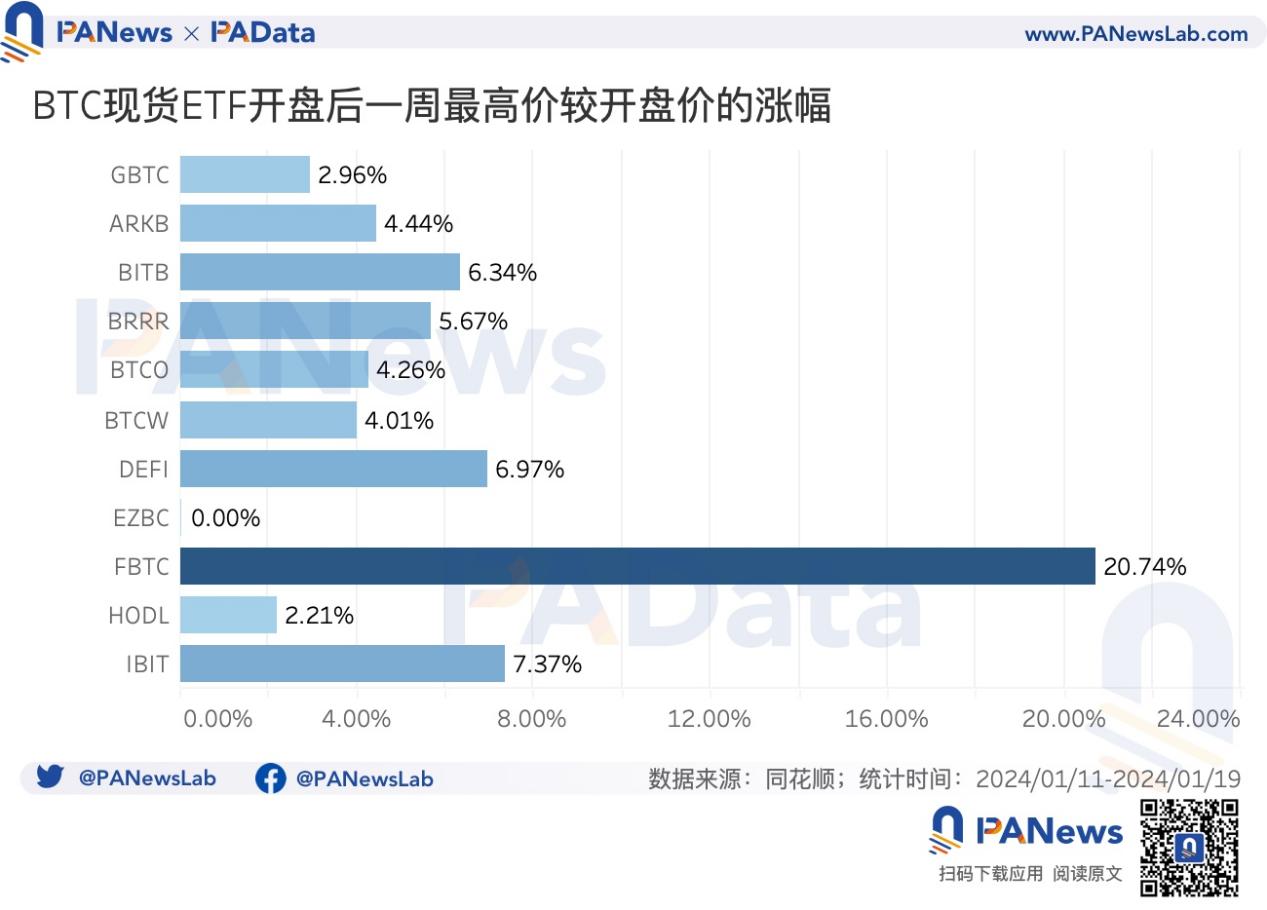
Except for Franklin's EZBC, which has been falling all the way and the opening price is the highest price, investors still have the opportunity to make a profit if they buy Bitcoin spot ETFs after the opening. Based on the theoretical maximum increase of the highest price after opening compared with the opening price on the 11th, the average maximum increase of the 11 ETFs is about 5.91%. Among them, Fidelity's FBTC has a maximum increase of more than 20%, far higher than other ETFs. The second is BlackRock's IBIT, with a maximum increase of more than 7%.
The price fluctuations of the newly listed Bitcoin spot ETF are still quite obvious. The average daily fluctuation of the market prices of the 11 ETFs is about 5.63%, calculated by the increase of the daily highest price compared to the lowest price. According to the data collected by CoinMarketCap, the daily average fluctuation of Bitcoin in the same period is about 4.78%, which is lower than the price fluctuation level of ETFs.
Among these ETFs, Fidelity's FBTC has the highest daily average fluctuation, reaching 8.10%. Most other ETFs, including GBTC, BITB, IBIT, etc., have daily average fluctuations of 5%-6%. Only BTCW and EZBC have daily average fluctuations lower than Bitcoin's daily average fluctuations during the same period.
Taking the ETF's NAV (Net Asset Value) on January 19 as a benchmark and comparing it with the closing price of the day, we can see that 5 of the 11 Bitcoin spot ETFs are at a discount, that is, the current market price is lower than NAV. Among them, BRRR has the highest discount level, with a discount rate of 0.51%. FBTC, EZBC and BTCW have similar discount rates, all exceeding 0.3%. GBTC has the lowest discount rate, about 0.27%.
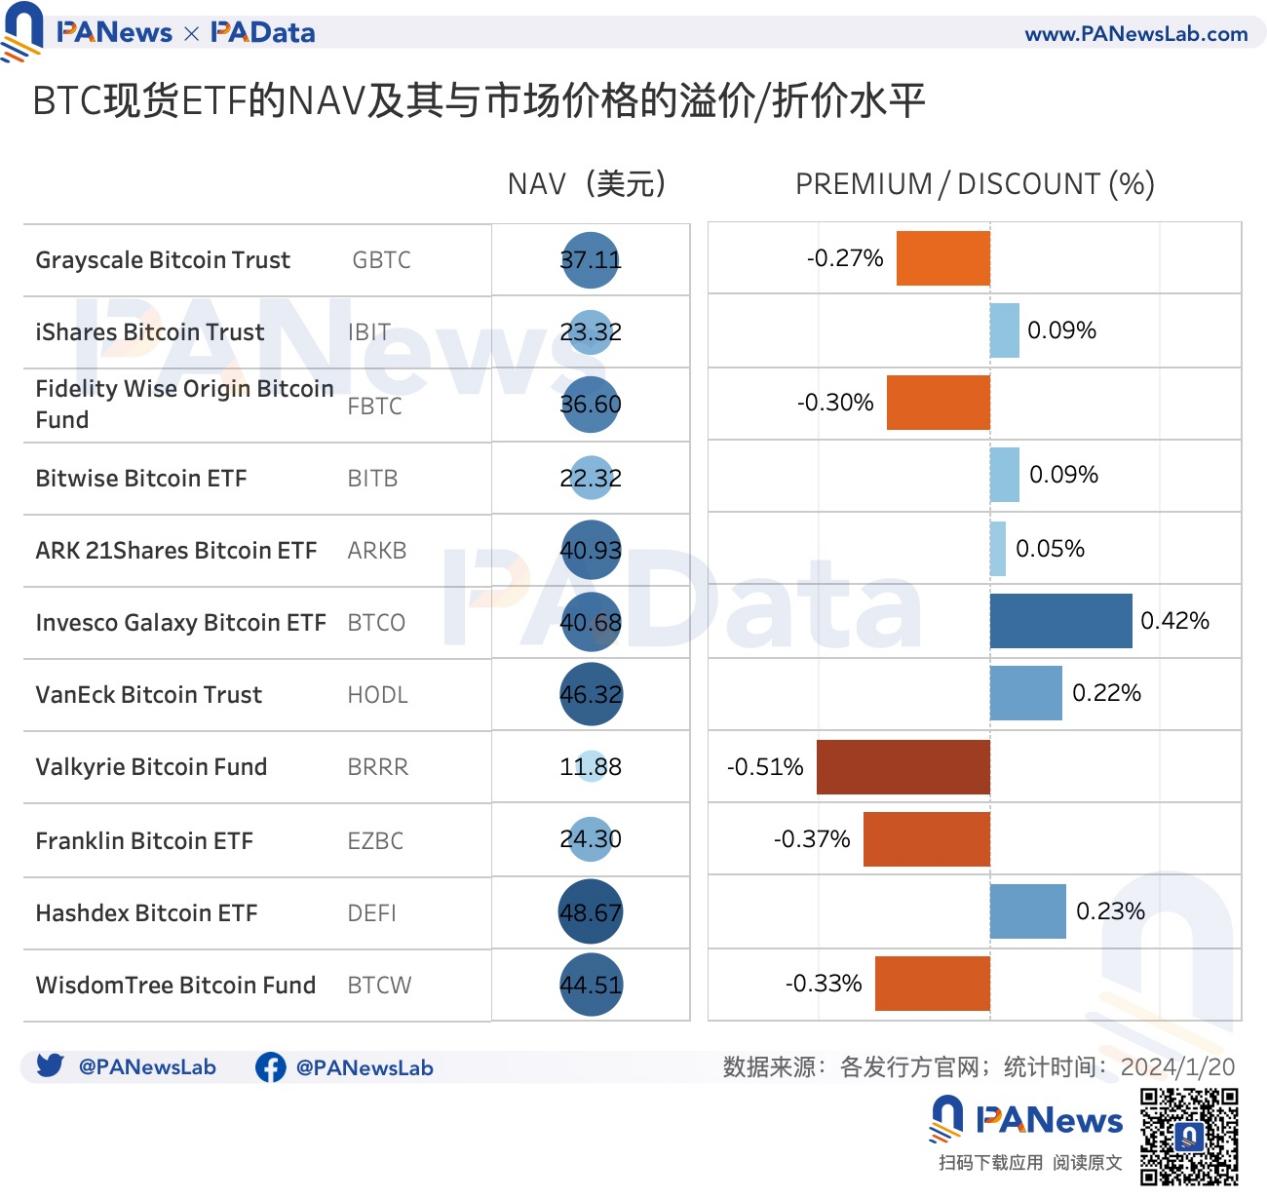
Some people believe that the arbitrage activities of some investors who bought discounted GBTC and shorted BTC over the counter are one of the reasons for the high selling pressure of GBTC. According to the current discount rate, the space for such arbitrage activities has been further reduced, and it is expected that the impact on market selling pressure in the future will be limited.
There are also 6 ETFs currently at a premium level, among which BTCO has the highest premium rate, reaching 0.42%. The premium rates of HODL and DEFI are both around 0.2%, while the premium rates of IBIT, BITB and ARKB are all less than 0.1%.
In terms of trading volume, the total trading volume of Bitcoin spot ETFs within 6 days after listing was about 16.691 billion US dollars, and the average daily trading volume was about 2.782 billion US dollars. Among them, GBTC is the ETF with the largest trading volume, with a total trading volume of 9.012 billion US dollars in 6 days, followed by IBIT and FBTC, which reached 3.194 billion US dollars and 2.649 billion US dollars respectively. In addition, the trading volume of 4 ETFs is less than 100 million US dollars, including BRRR, BTCW, DEFI and HODL.
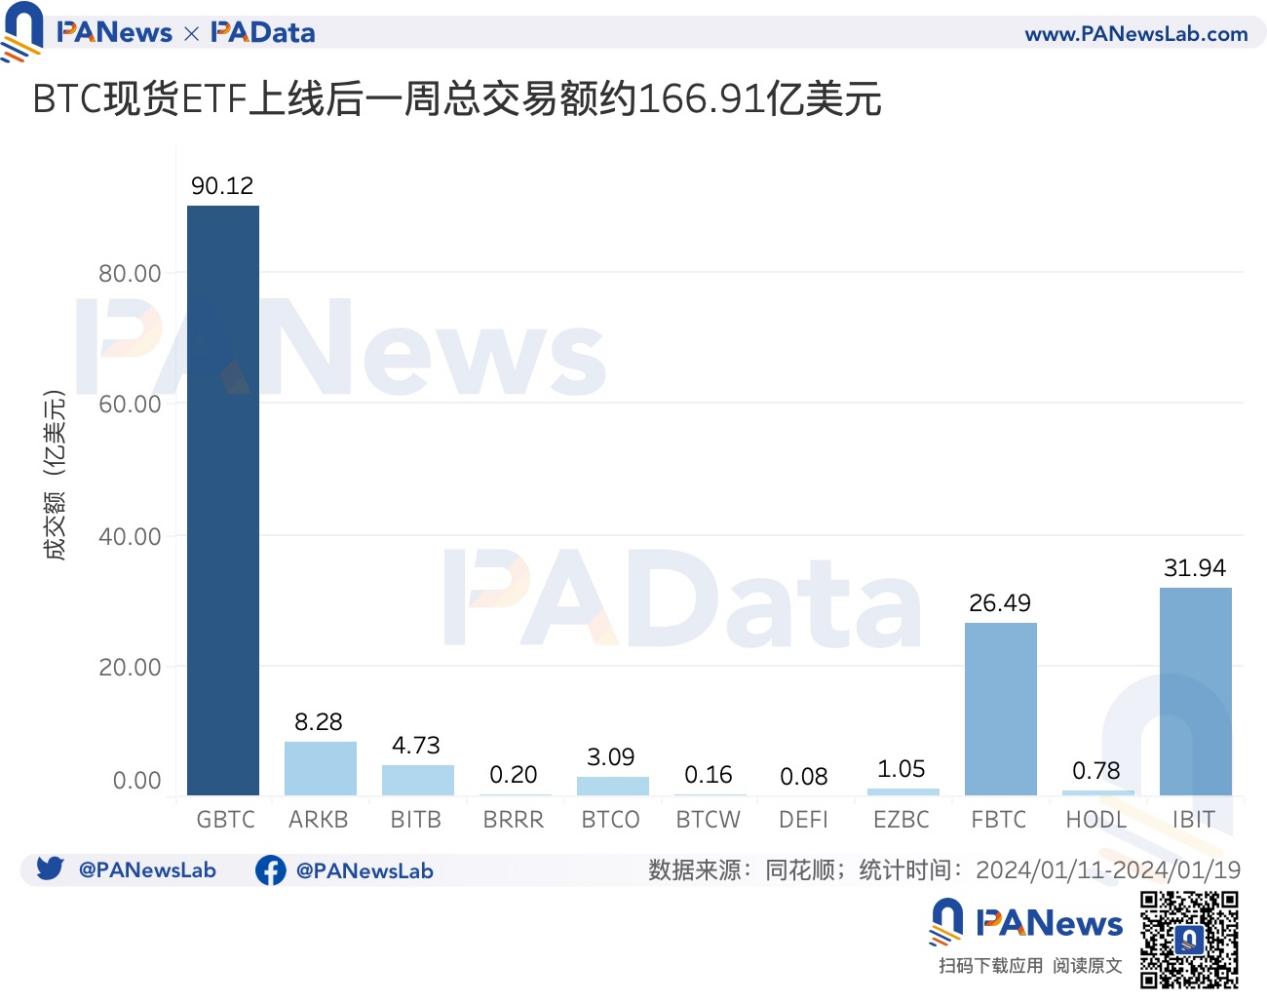
It should be emphasized that the trading volume of Bitcoin spot ETF is not equal to the capital flow in the Bitcoin trading market. Only the funds that actually flow into the Bitcoin trading market will have a direct impact on the crypto market.
According to SoSo Value data, based on the product of the daily circulation change of each ETF and the current NAV (Today's Shares-Yesterday's shares) x Current NAV), the Bitcoin spot ETF has a cumulative net inflow of about US$1.208 billion in the six days after its listing. Among them, the net inflow on the first day was US$628 million, and the net inflow on the 17th was US$562 million. In general, the issuance of the Bitcoin spot ETF has injected new funds into the crypto market, but it is still far from promoting a new round of "institutional bulls".
03. BTC price fell back to around $41,000, the on-chain circulation speed accelerated, and the accumulation trend increased
After the Bitcoin spot ETF was listed, what were the reactions of the Bitcoin trading market and on-chain performance? What future trends do these reactions imply?
From the most intuitive perspective of the currency price performance, Bitcoin reached a recent peak of $46,936 two days before the spot ETF was approved (January 9), and then began to fall back. The price on the day of approval (January 11) was $46,632, and by January 19, after all the positive news had been exhausted, the price of Bitcoin had fallen back to $41,261, a significant drop of 12.09% from the recent peak.
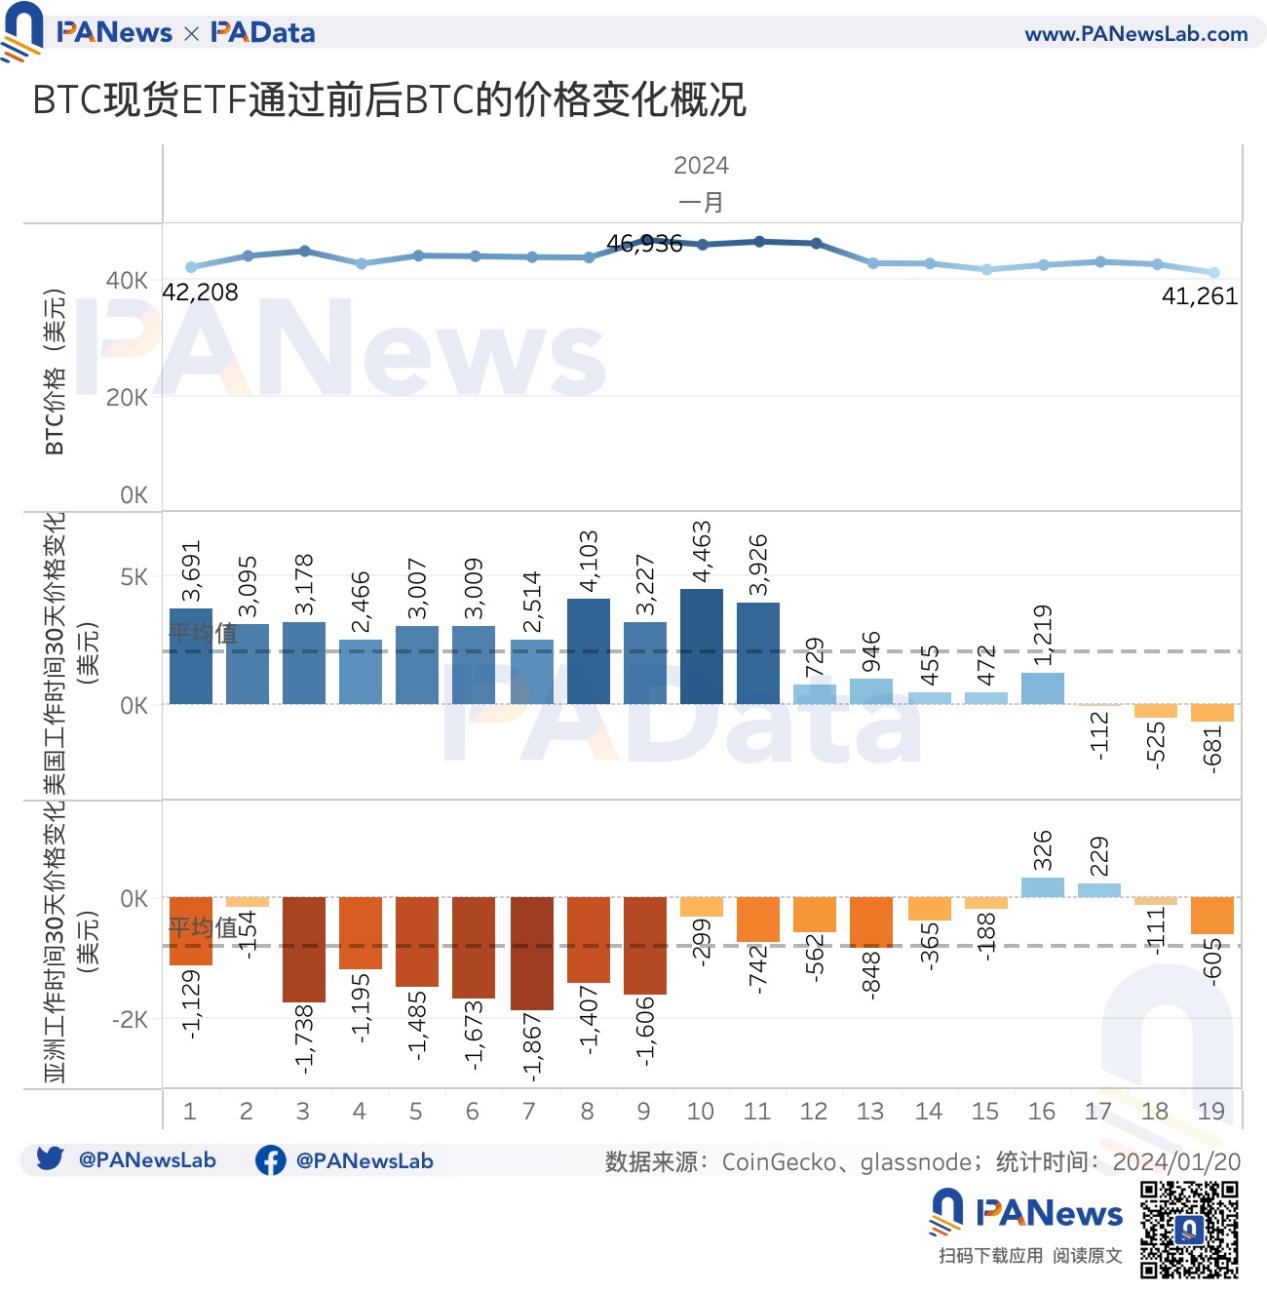
If we divide the changes in Bitcoin prices specifically into working hours in different regions, we can see that there are obvious differences in Bitcoin price performance during working hours in the United States and Asia (mainly China).
During U.S. working hours (8 a.m. to 8 p.m. Eastern Time), before the Bitcoin spot ETF was listed (including the 11th), the daily price of Bitcoin had a significant increase of $3,000-4,500 compared to 30 days ago. Even within 5 days after the ETF was listed (before the 16th), the daily price of Bitcoin was still on the rise compared to 30 days ago, but the increase fell back to around $1,000.
In general, investors in the United States are very optimistic about the approval and listing of Bitcoin spot ETFs, but in contrast, investors in Asia are the opposite.
During Asian working hours (i.e. between 8am and 8pm China Standard Time), the daily price of Bitcoin has basically fallen compared to 30 days ago before and after the listing of the Bitcoin spot ETF. Before the listing of the ETF (including the 11th), the daily price of Bitcoin has almost fallen by more than $1,000 compared to 30 days ago. After the listing, the decline has narrowed significantly to less than $1,000.
Judging from other market indicators, the Bitcoin market has shown some positive characteristics recently.
First, the market's purchasing power has increased. The Stablecoin Supply Ratio (SSR) is the ratio of the Bitcoin market value to the stablecoin market value. When the SSR decreases, it means that the current stablecoin supply has more "purchasing power" to buy BTC. After the Bitcoin spot ETF was listed, the SSR dropped from 13.022 to 11.662, a decrease of about 10.44%. The market's "purchasing power" has increased, which is conducive to digesting the selling pressure brought by GBTC.
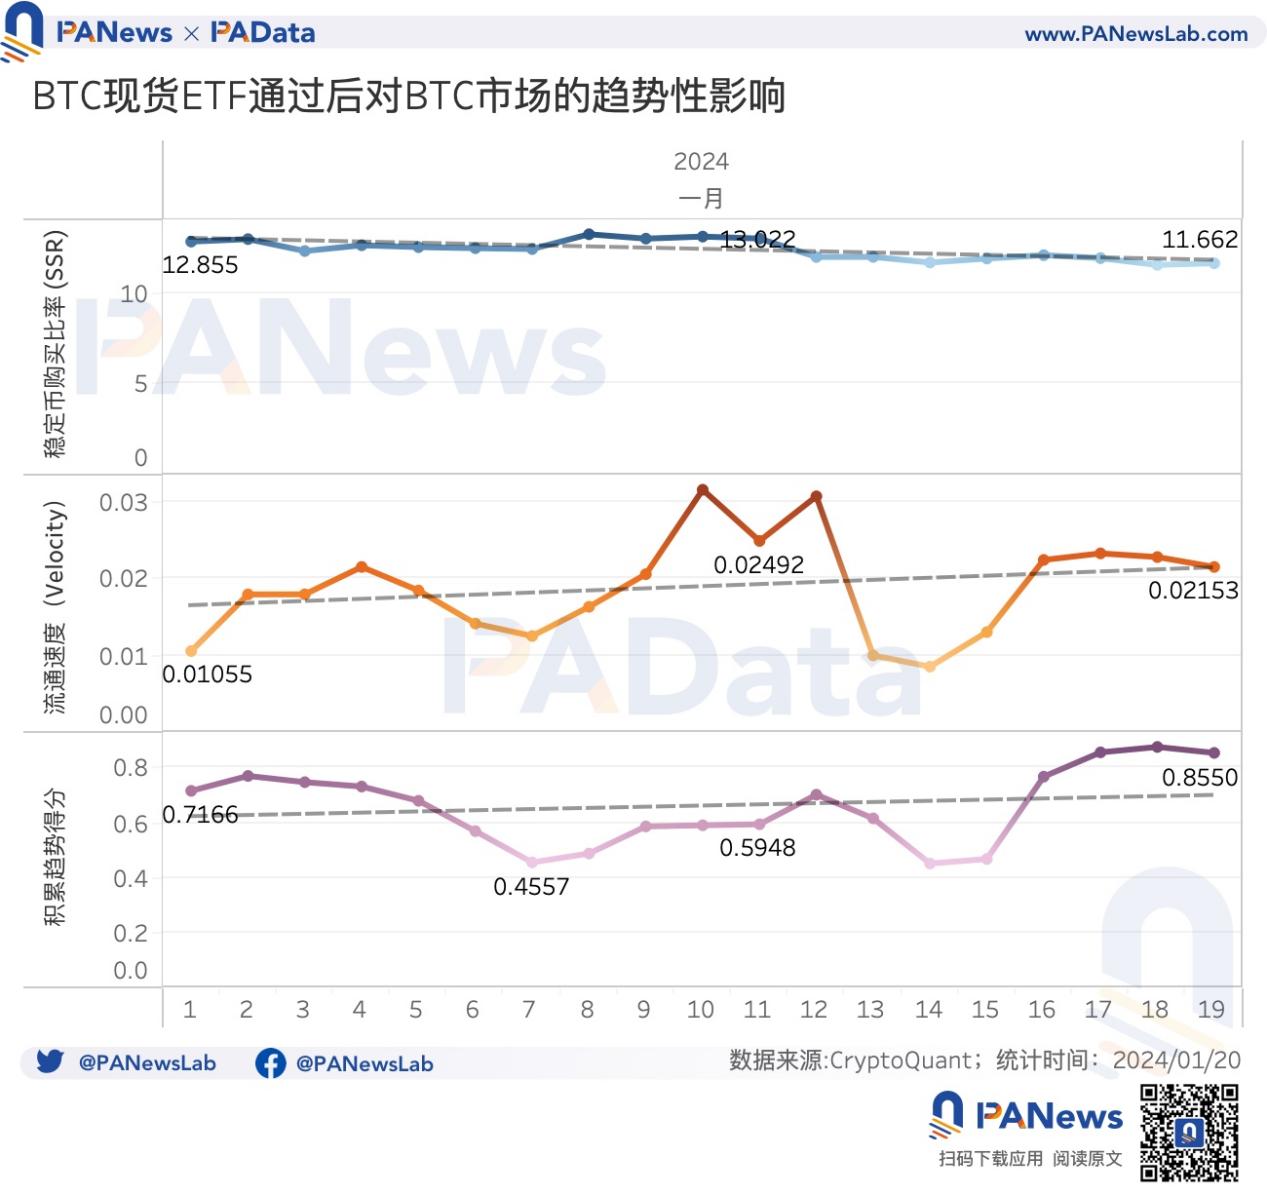
Second, the transaction activity on the Bitcoin chain has increased. Velocity is an indicator that measures the speed at which units circulate in the network. The higher the value, the faster the Bitcoin chain circulates and the higher the transaction activity. Since the beginning of this year, Velocity has risen from 0.011 to 0.022, reaching a recent peak of 0.032 on January 10, the day before the Bitcoin spot ETF was listed. The overall activity has increased significantly.
Third, more Bitcoin is being accumulated. The closer the Accumulation Trend Score is to 1, the more market participants are accumulating tokens overall. Since the beginning of this year, the accumulation trend of Bitcoin has risen from 0.72 to 0.86. Overall, participants have a clear tendency to accumulate tokens. Although the trend once fell below 0.5 before the listing of the Bitcoin spot ETF, which may be caused by participants taking profits at high levels, the trend has recently resumed its upward trend.
In general, the positive signals from the Bitcoin trading market and on-chain data show the market's confidence in future price trends. In addition, Bitcoin is expected to usher in its fourth production cut on April 22 this year. According to the price change pattern after the first three production cuts, the market has strong expectations for price increases after this production cut. Whether a virtuous cycle of interaction can be formed between the Bitcoin price and the Bitcoin spot ETF at that time is worth further observation.


