The information, opinions and judgments on markets, projects, currencies, etc. mentioned in this report are for reference only and do not constitute any investment advice.
 Written by: Shang2046
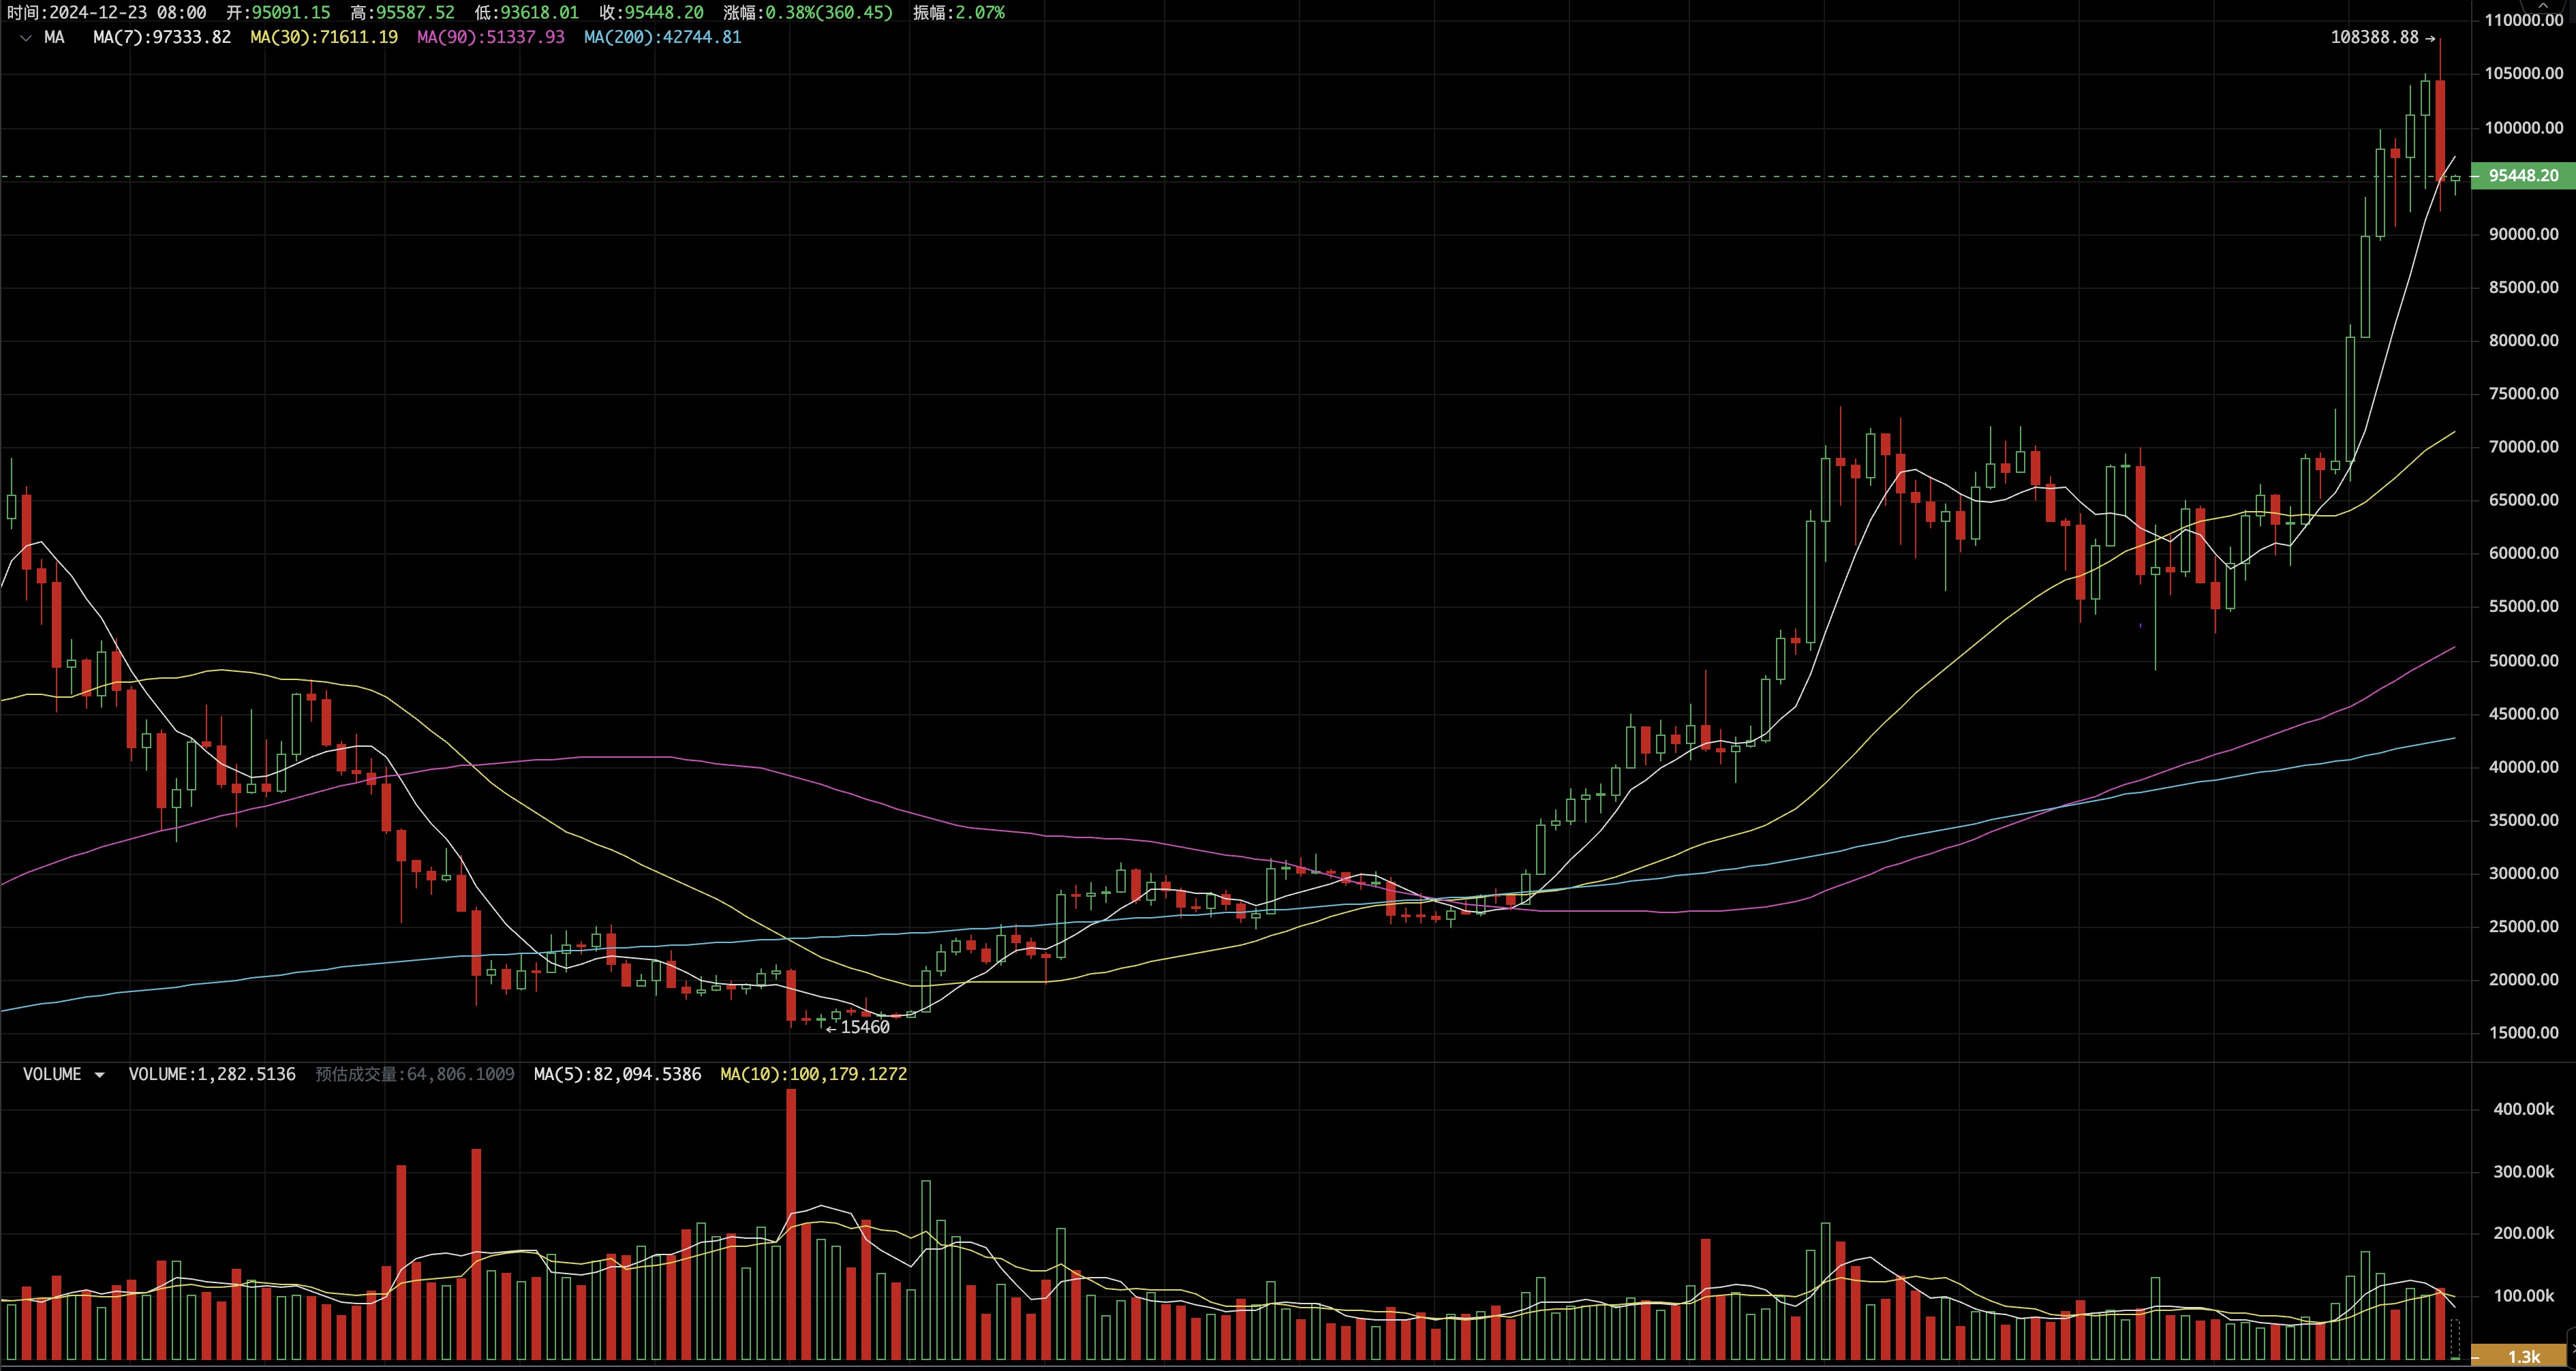
This week, BTC opened at $ 104,445.15 and closed at $ 95,087.75 . On December 17 , it hit a record high of $ 10,838.88 . In the end, this week it recorded a drop of 8.96% , with an amplitude of 15.58 % . The volume increased slightly, but it was basically at the same level as the previous two weeks.
This week is the first weekly correction since early November after BTC rose 38 % in a single month . The core factor is still the profit taking. In this cycle, whenever the profit rate of short-term investors reaches more than 30% , the probability of a correction increases rapidly, until their selling profit rate decreases or the cost of continued purchase is too high, the market will begin to evolve to the next stage.
At the same time, external changes also support adjustments. The main forces supporting the current round of BTC adoption rate to a higher level: the Fed’s interest rate cuts, the Trump effect, and micro-strategy BTC purchases have passed the initial strong period and entered the inter-holiday period. Coupled with factors such as the Christmas holiday that have a greater impact on BTC ETFs , BTC’s adjustment is also expected.
It should be pointed out that the above factors are not short-term forces, and will help the long-term development of BTC in the long run . Taking MicroStrategy as an example, it will officially enter the Nasdaq 100 Index on December 23 , which will open the door for mainstream US funds to passively allocate BTC .
The capital inflow slowed down significantly in the past week, and it may last for 1-2 months. Correspondingly, the selling scale of both long-term and short-term investors also began to slow down significantly, returning to the level before this round of pull-up. Under the balance of the two, the probability of the market being in a volatile market increases.
During this period, if the funds maintain a relative net inflow state and the cost of short-term investors further rises to above US$ 90,000 , the space for the next wave of main uptrend will be further opened up.
The relative support level of this round of adjustment may be at $85,000 - the cost line of short-term investors, which is currently rising gently.
Macro-financial and economic data
On December 18 , the Federal Reserve lowered the target range of the federal funds rate by 25 basis points for the third time , to between 4.25% and 4.50% . Unlike the rate cut that was widely expected by the market, Federal Reserve Chairman Powell delivered a hawkish speech that was beyond expectations.
Powell made it clear that the time to control inflation was not as long as expected, and the various data of the US economy performed strongly. Combined with the prediction of the impact of Trump's policies after taking office, the Fed is very cautious about the pace of interest rate cuts next year. The market interprets this as a clear statement of slowing down interest rate cuts in 2025 , and expects interest rate cuts next year to be reduced from more than 3 times to less than 2 times.
The Dow Jones has fallen for three consecutive weeks since hitting a new high in early December , and fell 2.25% this week . The Nasdaq fell 1.78% for the first time after rising for four consecutive weeks and hitting a new high . The Russell 2000, a small-cap index with a stronger correlation with BTC , fell 4.5% this week .
The US dollar index rose 1.23% to 108.26 on the day of the rate cut , and then fell back to 107.71 in the following days . London spot gold basically remained above 2,600 and the price was stable.
Funding and supply analysis
This week , funds continued to flow in at $ 1.202 billion , a significant slowdown from last week's $ 6.7 billion. Among them, net inflows continued for four consecutive days since December 19 , with BTC ETF net outflows of $ 670 million that day, which overall diluted the inflows of the previous few days.
On the supply side, in the past month, as BTC prices rose rapidly , the average daily amount of BTC transferred to exchanges by long-term and short-term investors increased from 30,000 to 40,000-45,000 . In the past week, this number gradually fell back to 30,000 .
The BTC inventory of exchanges continued to decline to 2.7843 million, a decrease of 16,000 from last week , indicating that the accumulation trend of chips is still continuing.
The short-term investor cost line is $ 85,700 , and the profit rate drops from 33 % to 13% .
In terms of leverage, the lending rate has dropped from the peak of 40% in the previous two weeks to around 10% and remained stable. The contract funding rate has also dropped from the peak of 99% to around 9% . Both show the rapid decline in market leverage.
Ecological analysis
The number of new BTC addresses and active addresses remained basically stable, but the scale of value transfer declined significantly.
The number of new addresses and active addresses in the Ethereum ecosystem increased slightly. Other active platforms such as Solana , Base , and Polygon remained vigorous, with a significant increase in new addresses, active addresses, and Transactions .
Cycle Indicators
The EMC BTC Cycle Metrics indicator is 0.75, and the market is in an upward phase.


