
1. Market observation
Keywords: OM, ETH, BTC
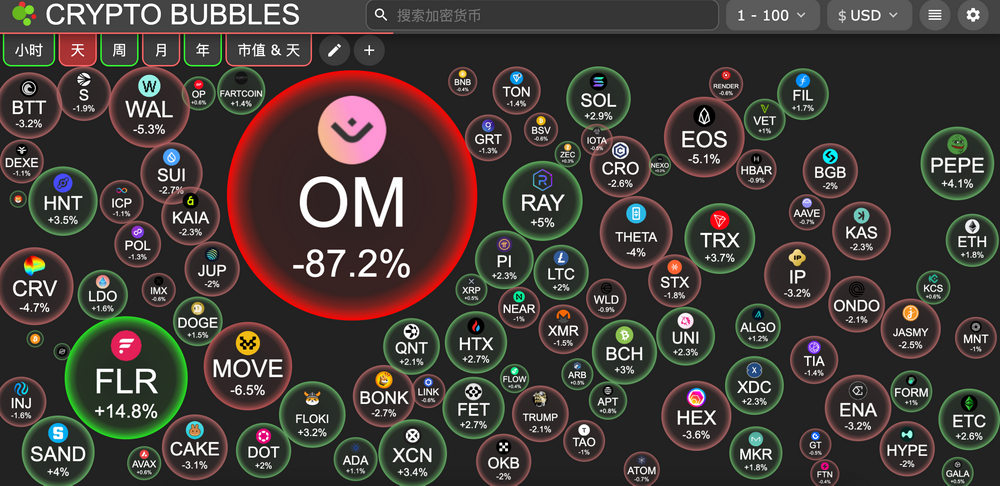
The RWA project MANTRA (OM) plummeted this morning, with the price falling from $6.35 to $0.38 in a short period of time, causing the market value to evaporate by more than $5.5 billion. Faced with market panic, the MANTRA team quickly issued a statement attributing the decline to "irrational liquidation" and emphasizing that it had nothing to do with the fundamentals of the project. However, in-depth observation found that OM has experienced many violent pull-ups since November last year, and has long been labeled as a "strong monster coin" in the community. Community analysis revealed that MANTRA has many structural problems, including high control, repeated changes in airdrop rules, and the team actually controlling 90% of the supply. These factors have led to its extremely low actual circulation, making the price extremely easy to manipulate, and ultimately triggered the crash. In addition, the market value of $RFC on the Solana chain exceeded $100 million, becoming the only Meme coin to break 100 million in the near future. At the same time, the market has also seen the emergence of a spoof derivative currency similar to fartcoin, $DB, and the Meme coin $MUTUMBO that attracted attention due to Ansen's shouting.
Despite the increased volatility in the global market, BTC whale investors have not withdrawn from the market. According to data analysis by CryptoQuant, the current behavior pattern of BTC whales is highly similar to the accumulation phase during the sideways trading period from August to September last year, indicating that large funds are still strategically positioned. Although the S&P Volatility Index has soared to its highest level since August last year, clearly showing that market uncertainty is rising, the ratio of Bitcoin to VIX has hit the long-term trend line support. Historical data shows that whenever the Bitcoin/VIX ratio hits this trend line, it often marks the stage bottom of Bitcoin prices, followed by a significant rebound, which provides technical support for the current market. Arthur Hayes, co-founder of BitMEX, boldly predicted that if the current market situation continues, Bitcoin may enter a "only up and no down mode". Ryan Lee, chief analyst at Bitget Research, predicted that the price of BTC may fluctuate between $80,000 and $85,000, and advised traders to pay close attention to the macroeconomic situation and capital flows. It is worth noting that Andrew Kang, co-founder of Mechanism Capital, recently went long on BTC at a price of $77,000 with 40x leverage and doubled his Bitcoin holdings to $200 million, and has now achieved a profit of $6.8 million.
In the field of regulation, Tim Scott, chairman of the U.S. Senate Banking, Housing and Urban Affairs Committee, recently released a positive signal, predicting that the Cryptocurrency Market Structure Act will officially become law by August 2025. He also pointed out that the Senate Banking Committee has advanced a comprehensive stablecoin regulatory bill, the GENIUS Act, in March 2025, indicating that the U.S. legislature is making crypto policy a priority. In addition, the tariff exemption policy announced by Trump over the weekend, especially the exemption measures for semiconductors and computer components, was interpreted by the market as a long-term positive for the crypto ecosystem. These core components are essential for cryptocurrency mining, blockchain infrastructure construction, and the development of AI-based crypto tools. This policy indirectly boosted confidence in the crypto market and pushed the price of Bitcoin back to $85,900.
However, the global macroeconomic situation is facing major challenges, and several Wall Street giants have issued warnings. BlackRock CEO Larry Fink warned that the United States may have begun to enter a recession, citing intensified economic pressures and protectionist trade policies as the main drivers. Meanwhile, JPMorgan Chase CEO Jamie Dimon said he was preparing for possible chaos in the nearly $30 trillion U.S. Treasury market and expected the Fed to act only if the market began to panic. According to data from the U.S. Treasury Department in January this year, Japan held $1.079 trillion in U.S. Treasury bonds, ranking first, followed by China, which held $760.8 billion. Against the backdrop of increasing global economic uncertainty, the gold market performed well, with spot gold prices breaking through historical highs to $3,245.45 per ounce. Major investment banks have raised their gold price forecasts: Goldman Sachs expects gold prices to reach $3,700 by the end of the year, and may even reach $4,500 in extreme cases; UBS also raised its forecast to $3,500, believing that Chinese investors have strong buying potential. As the global order is restructured, the continued growth in demand for gold by central banks will provide long-term support for gold prices.
2. Key data (as of 12:00 HKT on April 14)
(Data sources: Coinglass, Upbit, Coingecko, SoSoValue, GMGN, Tomars)
Bitcoin: $84,781.34 (-9.58% year-to-date), daily spot volume $30.943 billion
Ethereum: $1,637.32 (-50.96% year-to-date), with a daily spot volume of $14.762 billion
Fear and corruption index: 31 (panic)
Average GAS: BTC 1.06 sat/vB, ETH 0.43 Gwei
Market share: BTC 62.6%, ETH 7.3%
Upbit 24-hour trading volume ranking: XRP, AERGO, BTC, COW, ORCA
24-hour BTC long-short ratio: 1.0969
Sector gains and losses: RWA sector fell 44.62%, SocialFi sector fell 1.89%
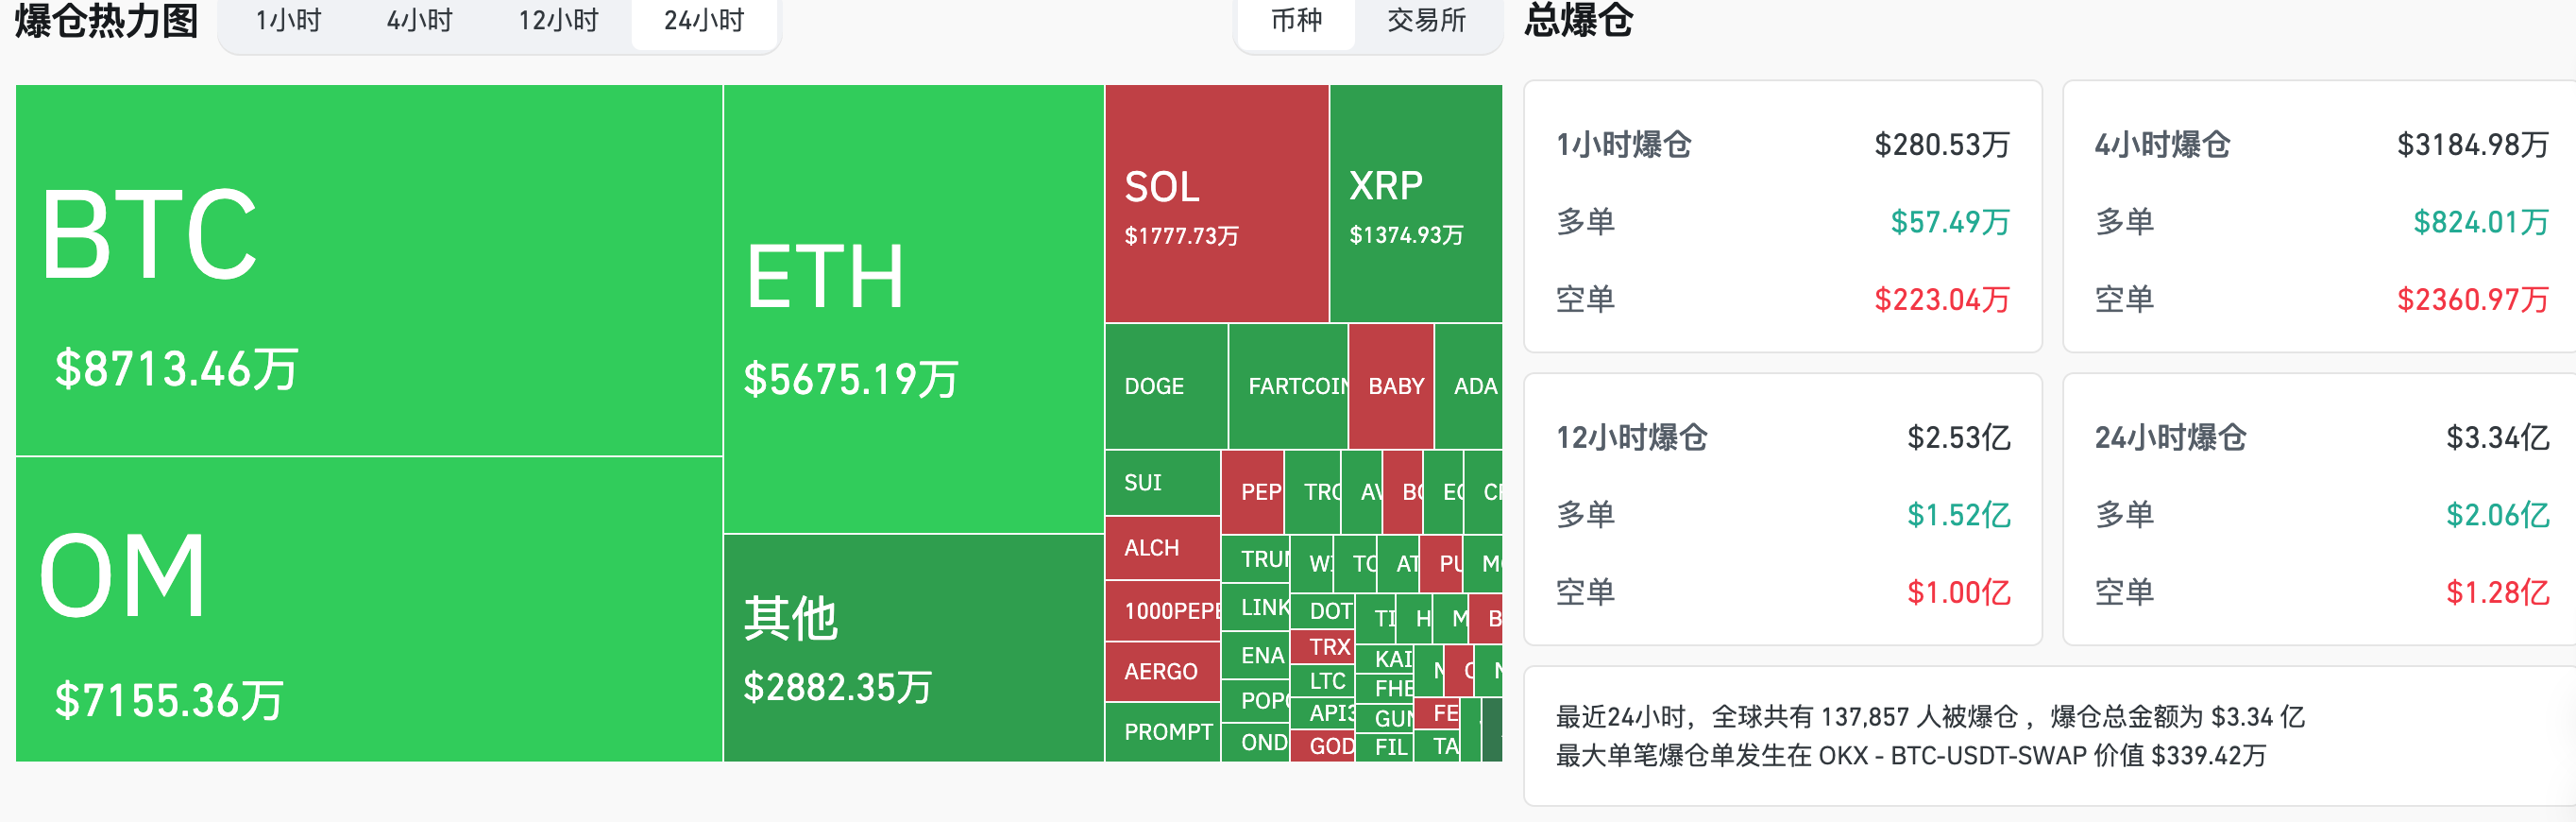
24-hour liquidation data: A total of 137,857 people were liquidated worldwide, with a total liquidation amount of US$334 million, including BTC liquidation of US$87.13 million, ETH liquidation of US$56.75 million, and OM liquidation of US$71.55 million
BTC medium- and long-term trend channel: upper channel line ($83,334.67), lower channel line ($81,684.48)
ETH medium and long-term trend channel: upper channel line ($1682.34), lower channel line ($1649.02)
*Note: When the price is higher than the upper and lower edges, it is a medium- to long-term bullish trend; otherwise, it is a bearish trend. When the price passes through the cost range repeatedly within the range or in the short term, it is a bottoming or topping state.
3. ETF flows (as of April 11 EST)
Bitcoin ETF: -$1.03 million
Ethereum ETF: -$29.2 million
4. Today’s Outlook
Russia's VK shuts down its NFT platform on April 15 , and users are required to migrate their assets as soon as possible before this day
Sei (SEI) will unlock 225 million tokens on April 15, worth approximately $38.5 million
Solayer (LAYER) will unlock 48.15 million tokens on April 15, worth approximately $67.7 million
Starknet (STRK) will unlock 163 million tokens on April 15, worth approximately $24.4 million
The biggest increases in the top 500 stocks by market value today: RFC up 87.42%, GODS up 82.64%, DOGINME up 33.16%, AERGO up 26.29%, and ALCH up 20.23%.
5. Hot News
Macro Outlook of the Week: Trump "plays too hard", Fed officials will go all out
Bloomberg: The Trump family’s cryptocurrency projects have a total book profit of nearly $1 billion
Japanese listed company Metaplanet announced that it has increased its holdings of 319 Bitcoins
A whale/institution withdrew 15,953 ETH from OKX 5 hours ago, worth $26.16 million