Author: Lawrence
In April 2025, the price of Bitcoin continued to fluctuate between $83,000 and $85,200, failing to break through the key resistance level of $86,000. This price fluctuation is closely related to subtle changes in macroeconomic data.
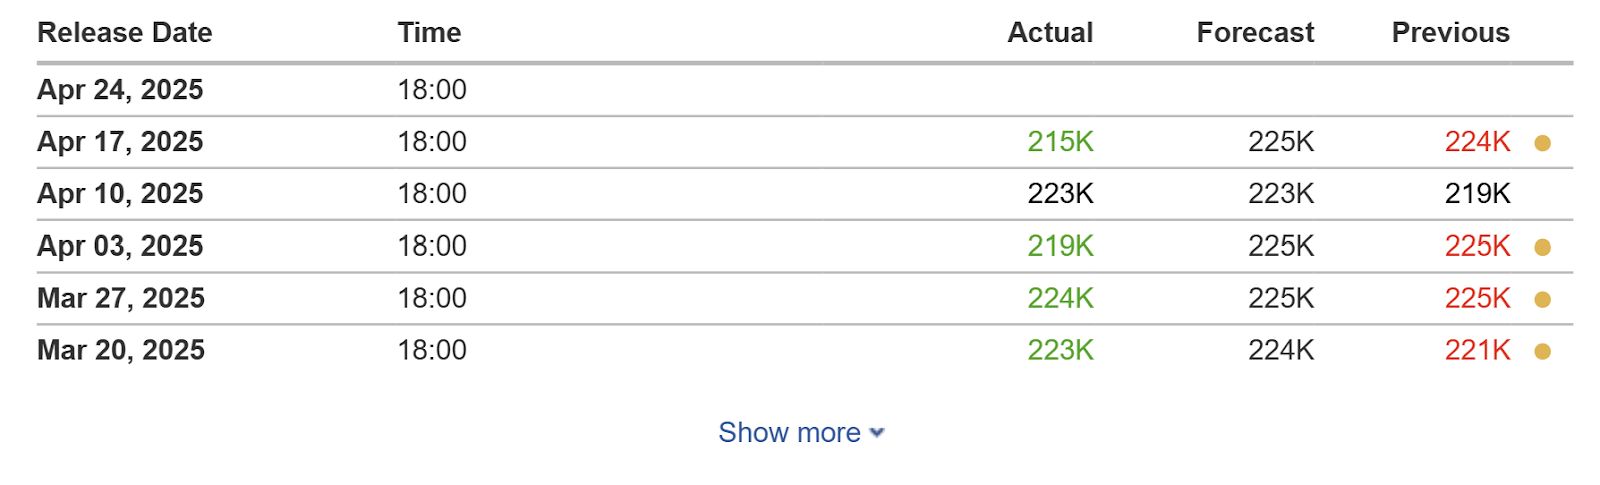
U.S. unemployment claims data.
On April 17, the U.S. Department of Labor announced that the number of initial unemployment claims was 215,000, lower than the market expectation of 225,000, indicating that the labor market remains resilient. This data is seen as an important signal of the stability of the U.S. economy, but it also lowered the market's expectations for the Fed to cut interest rates, thereby suppressing short-term speculative sentiment in risky assets.
In his speech on April 16, Federal Reserve Chairman Powell emphasized that the "reciprocal tariff" policy recently implemented by the United States far exceeded expectations and may lead to the dual pressure of rising inflation and slowing economic growth.
Meanwhile, Trump told a news conference: "I think he (Powell) is terrible, but I can't complain," noting that the economy was strong during his first term. Trump then went on to complain about Powell, saying he thinks the Fed chairman is "playing politics" and that Powell is "someone I never really liked."
Trump then said: I think Powell will cut interest rates sooner or later. The only thing Powell is good at is cutting interest rates.
Although the Federal Reserve has made it clear that it will not intervene in the market or implement interest rate cuts, the European Central Bank has taken the lead in lowering interest rates from 2.50% to 2.25%, a new low since the end of 2022, in an attempt to ease the impact of tariff policies on the economy. This divergence in global monetary policies has further exacerbated market uncertainty, prompting investors to re-evaluate the safe-haven properties of assets such as Bitcoin.
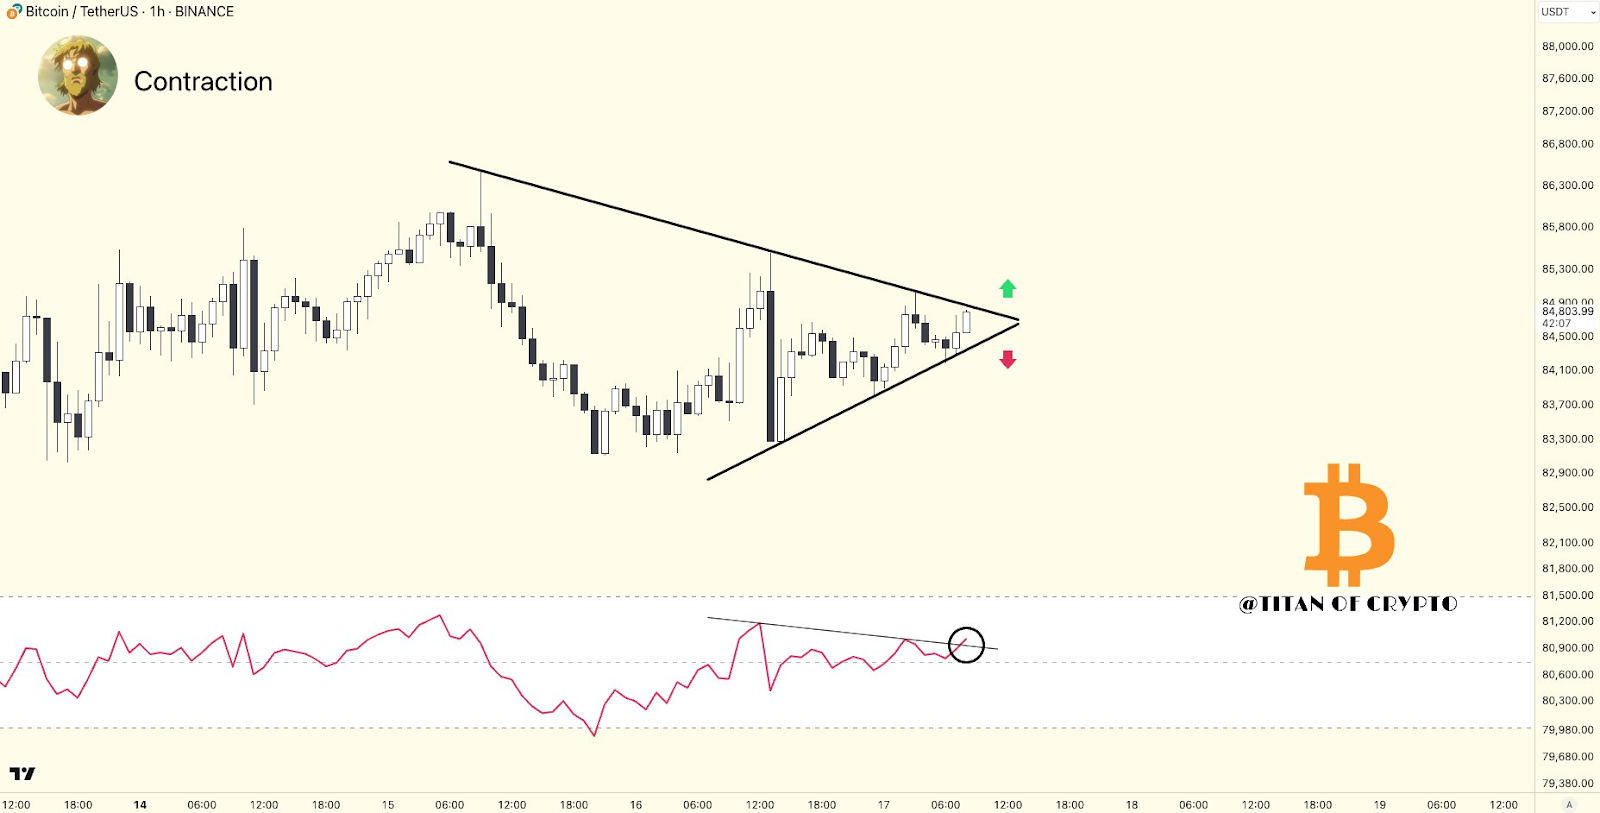
From a technical point of view, Bitcoin is at a critical "turning point". Anonymous trader Titan of Crypto pointed out that the price of BTC continues to shrink within the triangle pattern, and the RSI indicator is above 50 and trying to break through the resistance level, suggesting that a directional breakthrough is coming. Order flow analyst Magus believes that if Bitcoin cannot break through $85,000 as soon as possible, the long-term chart may turn bearish. The competition in this price range is not only about the short-term trend, but also may determine whether Bitcoin can continue the bull market pattern since 2024.
Historical Correlation: Bitcoin’s Lag Effect After Gold’s New Highs
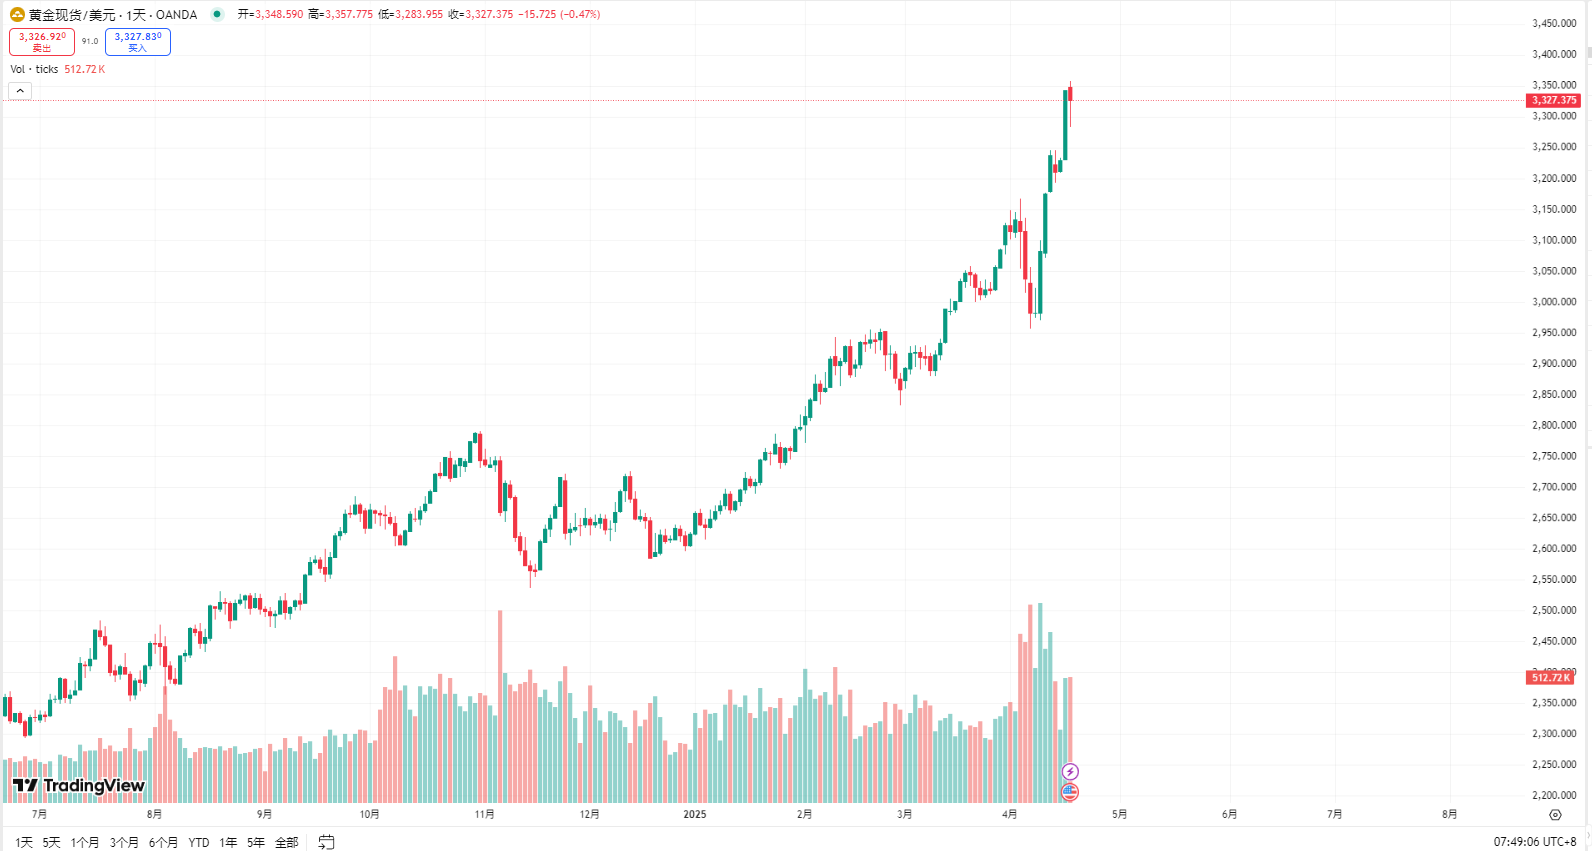
On April 17, the price of gold soared to an all-time high of $3,357 per ounce, a phenomenon that has attracted widespread attention in the market to the subsequent trend of Bitcoin.
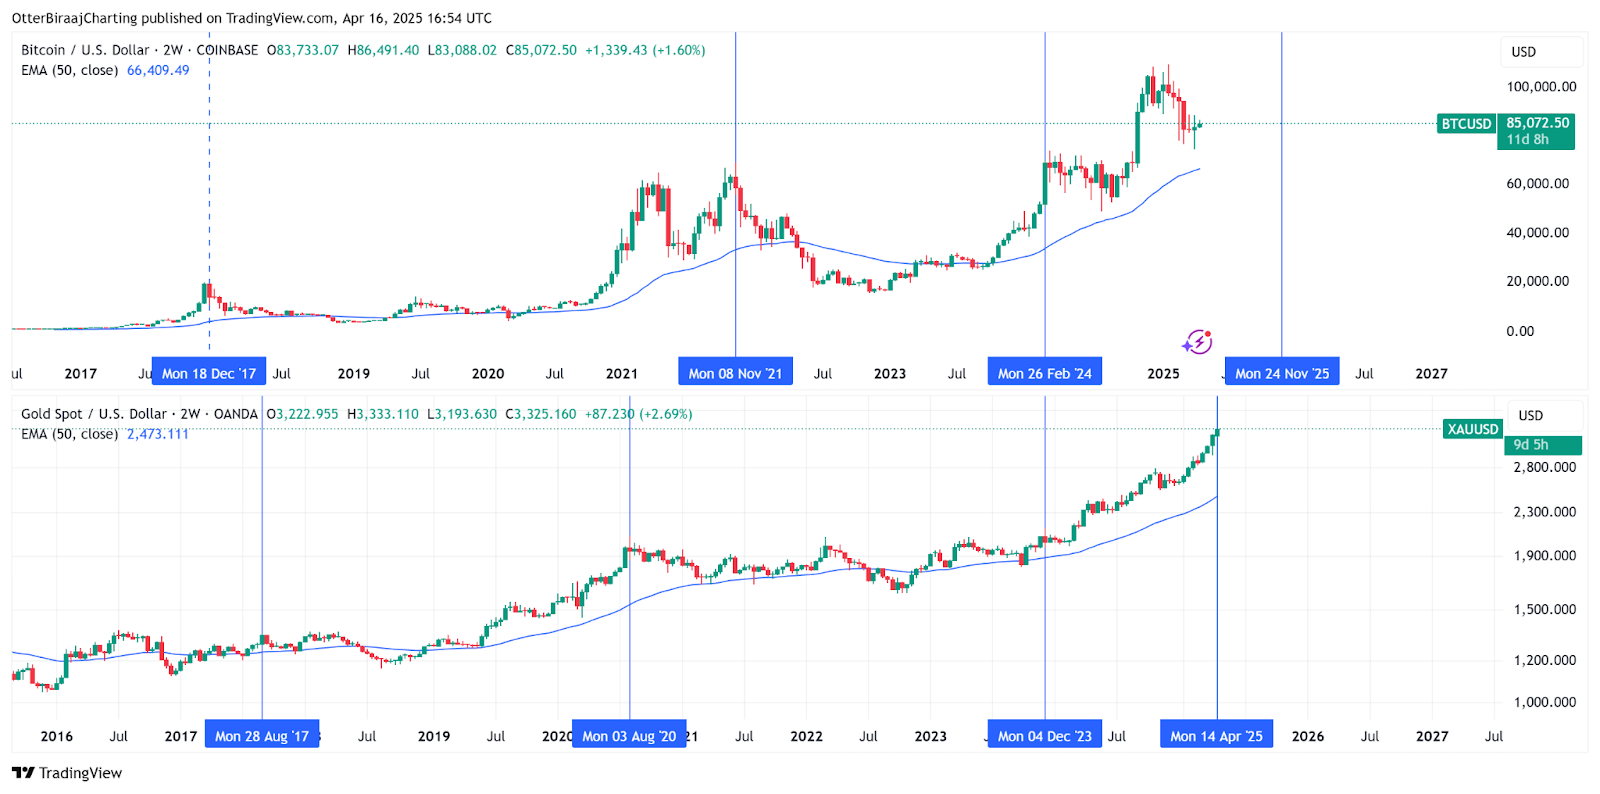
Comparison of the historical trends of Bitcoin and gold.
Historical data shows that there is a significant lagging correlation between gold and Bitcoin: whenever gold hits a new high, Bitcoin usually follows and breaks the previous high within 100-150 days.
For example, after gold rose 30% in 2017, Bitcoin hit an all-time peak of $19,120 in December of the same year; after gold broke through $2,075 in 2020, Bitcoin rose to $69,000 in November 2021.
This correlation stems from the complementary roles of the two in times of economic uncertainty. As a traditional safe-haven asset, gold is usually the first to reflect inflation expectations and monetary easing signals; while Bitcoin, due to its rigid supply and decentralized characteristics, has become a latecomer in the "digital gold" narrative.
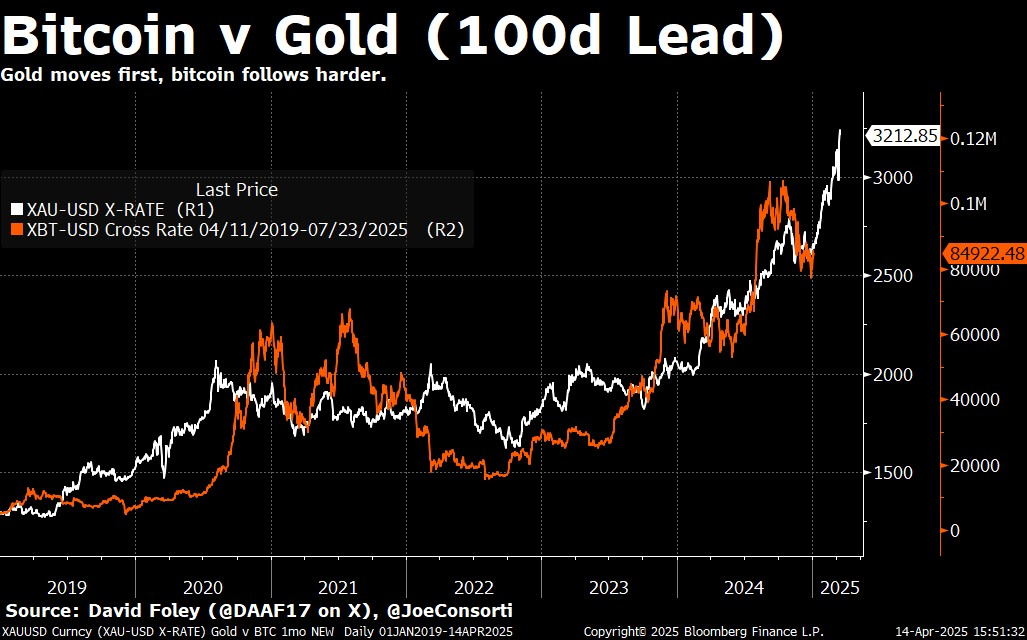
Correlation between Bitcoin and gold price movements.
Theya growth director Joe Consorti pointed out that Bitcoin's lag behind gold's trend is related to its market maturity - institutional investors need longer to complete the allocation transition from traditional assets to crypto assets.
Currently, the surge in gold prices resonates with the uncertainty of the Federal Reserve's policy.
Mike Novogratz, CEO of Galaxy Digital, calls this stage the "Minsky moment" of the US economy, which is the critical point where debt is unsustainable and market confidence collapses. He believes that the simultaneous strength of Bitcoin and gold reflects investors' concerns about the weakening of the US dollar and the US$35 trillion national debt, while tariff policies have exacerbated the turmoil in the global economic order.
Cycle Model and Long-term Forecast: Bitcoin’s “Power Law Curve” and $400,000 Target
Despite the short-term volatility, analysts remain optimistic about Bitcoin's long-term prospects. Anonymous analyst apsk32 predicts based on the "power law curve time contour" model that Bitcoin will enter a parabolic growth phase in the second half of 2025, with a target price of up to $400,000.
The model normalizes the market value of Bitcoin with the market value of gold and measures the value of Bitcoin in ounces of gold, revealing its potential valuation logic as "digital gold."
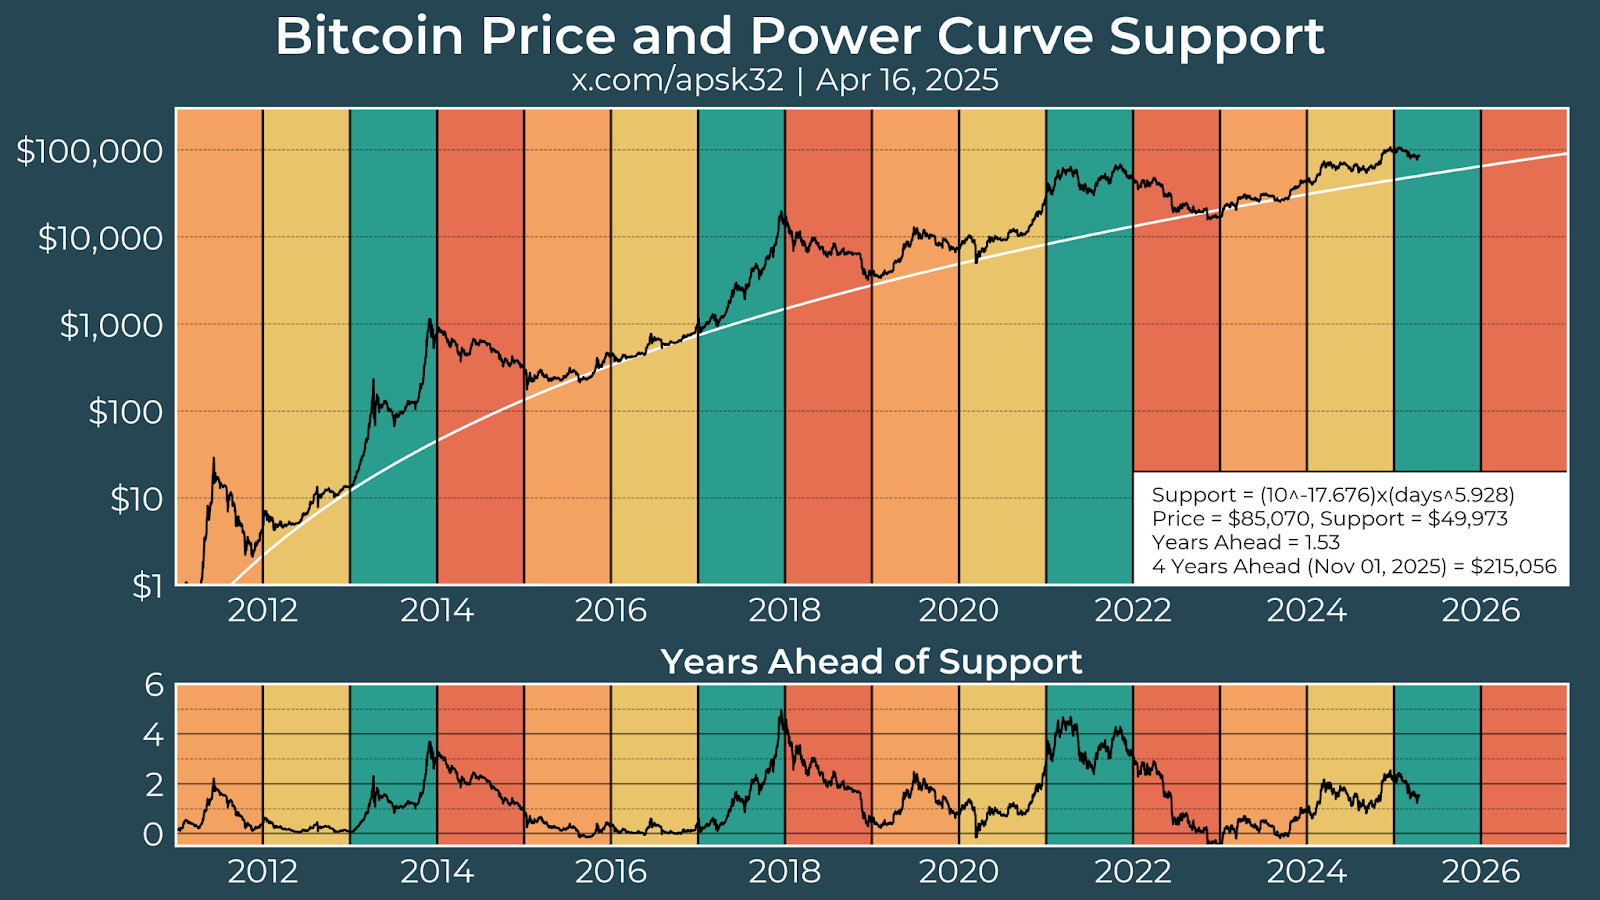
Bitcoin price and hashrate graph.
The historical cycle also supports this prediction. Bitcoin's halving effect (every four years) usually triggers a bull market within the next 12-18 months, and the halving event in April 2024 may show its power in the third or fourth quarter of 2025.
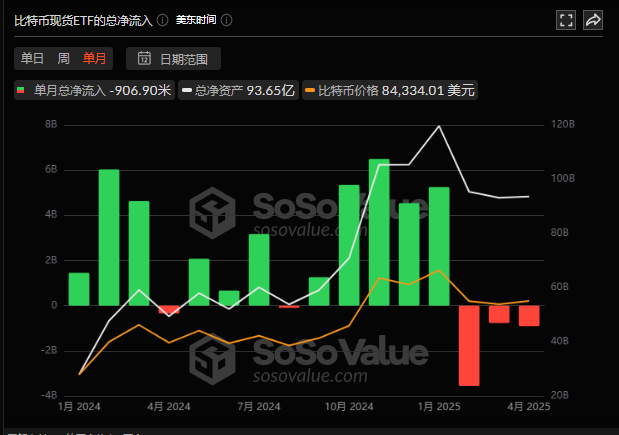
At the same time, institutional investors continue to increase their holdings of Bitcoin through compliant tools such as ETFs. As of February 2025, the total net asset value of BTC ETFs has reached US$93.6 billion, further consolidating its position as a mainstream asset.
However, the market also needs to be wary of the risk of "expected overdraft". The current bull market is mainly driven by institutional hoarding and ETF funds. Retail investor participation continues to be sluggish, and the BTC balance on exchanges has fallen to the lowest level since 2018, exacerbating the risk of a liquidity trap. If Bitcoin fails to expand more application scenarios (such as payment and smart contracts), its valuation may face pressure to pull back.
Policy variables: tariffs, liquidity crisis and market reconstruction
In April 2025, U.S. tariffs on Chinese goods soared to 104%, and countries such as Japan and Canada also faced high tariff shocks. This policy not only pushed up global inflation expectations, but also reshaped the pattern of capital flows. Bloomberg data shows that tariffs have caused U.S. prices to rise by about 2.5%, and the average annual household expenditure has increased by nearly $4,000. In response to economic pressure, the Federal Reserve may be forced to restart quantitative easing, and excessive money supply will further strengthen Bitcoin's anti-inflation narrative.
The tariff policy also highlights the decentralized advantages of Bitcoin. In the context of traditional cross-border payments being blocked, stablecoins (such as USDT) have become a tool for emerging markets to circumvent capital controls due to their low cost and instant settlement characteristics. For example, the stablecoin premium rate in Argentina, Turkey and other countries has long been maintained at 5%-8%, reflecting the urgent need under the fiat currency credit crisis.
However, the short-term market volatility caused by tariffs cannot be ignored. On April 9, the price of Bitcoin fell to $80,000, a daily drop of 7%, and the derivatives market had a single-day liquidation of more than $1 billion. This volatility shows that Bitcoin has not completely gotten rid of the label of "high-risk assets", and its price is still severely affected by macro sentiment and leveraged liquidation.
Conclusion: The logic of asset allocation under the new economic paradigm
The core contradiction in the current market lies in the mismatch between overdrawn policy expectations and endogenous momentum. The long-term value of Bitcoin depends on the dual test of regulatory framework and technical bottlenecks.
Investors need to be aware that 2025-2026 may be the "last carnival" for Bitcoin.
In this changing situation, the complementarity between gold and Bitcoin has become more and more significant. Gold, with its historical consensus and liquidity advantages, remains the ultimate safe-haven choice in a crisis; while Bitcoin has verified its "digital gold 2.0" attribute through "decorrelation" and has become the core target of a diversified investment portfolio.
For ordinary investors, allocating a combination of physical gold and mainstream cryptocurrencies and paying attention to "mispricing opportunities" in emerging market bonds may be the best strategy to withstand turmoil.
History will not simply repeat itself, but it always rhymes. Whether it is the turning point of Bitcoin at $85,000 or the new high of gold at $3,357, these figures are the epitome of the reconstruction of the global economic order. Only by maintaining rationality and foresight can we capture new opportunities in uncertainty.