1. Macroeconomic impact

  • Pros:
    • The strong services PMI (58.5) and retail sales (+0.7%) boosted economic confidence and were positive for risky assets in the short term.
    • GDP (+3.1%) and stable employment (initial jobless claims 220,000) show economic resilience, providing potential support for the crypto market.
  • Negative:
    • The manufacturing PMI (48.3) shrank, housing starts were sluggish, and durable goods orders fell (-1.1%), indicating weak growth, which may suppress market risk appetite.
    • The consumer confidence index declined (104.7), indicating that consumption drive may weaken.

Policy focus:

  • The balance between economic expansion and Fed policy
    • Economic data exceeding expectations may cause the Federal Reserve to maintain a tight monetary policy for a longer period of time (“higher for longer”), which may put pressure on risky assets such as Bitcoin.
    • On the other hand, if economic data is weak or a downward trend emerges, the Fed may tend to ease, which is good for Bitcoin prices.
  • Pay attention to the attribute switching of Bitcoin
    • In a strong economic environment, Bitcoin may be viewed as a risky asset that would benefit from an increase in risk appetite.
    • If the risk of economic recession increases, Bitcoin's safe-haven properties may be re-evaluated by the market and become a safe haven for funds.
  • Long-term coping strategies
    • Although short-term fluctuations in economic data will affect market sentiment, in the long run, we need to pay attention to the profound impact of macro liquidity (such as the Federal Reserve's balance sheet and fiscal liquidity) on Bitcoin prices.

2. On-chain Funding Dynamics

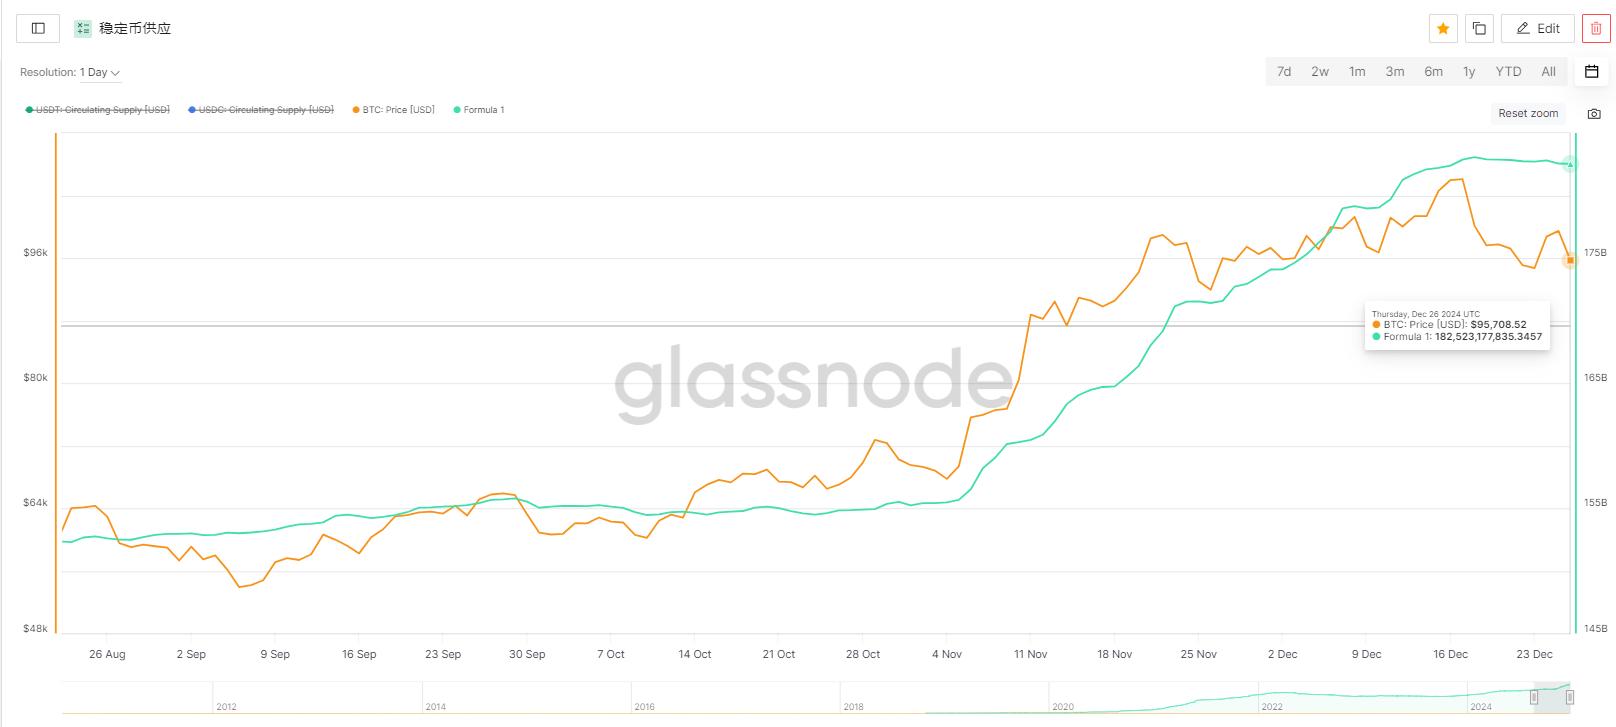
  • Stablecoin issuance is weak: this week, the net decrease of stablecoins is 367 million US dollars , with an average daily deflation of 31 million. The inflow of funds has weakened significantly, which may limit the upside of BTC.
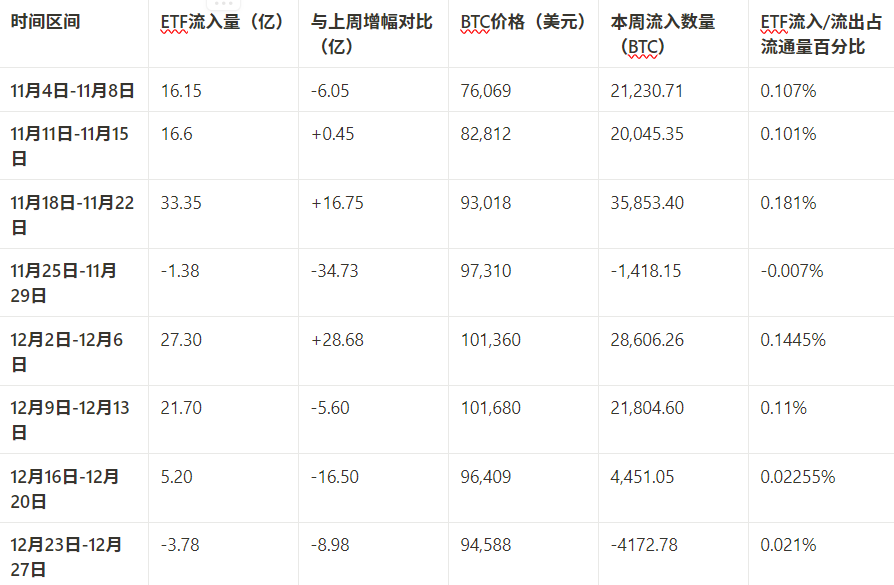
  • ETF funds continued to outflow: the net outflow this week was US$378 million , and the circulation volume accounted for only 0.021% , reflecting the weak willingness of institutions to enter the market.

3. BTC Market Data

  • Decreased trading volume: This week's average daily trading volume was $18.17 billion , down 8.36% from the previous month. Market activity decreased due to holiday effects and witching day liquidations.
  • Price weakness: BTC price fell from $96,430 to $94,876 , and insufficient liquidity provided limited support for the price.

4. BTC Market Share and Altcoin Trends

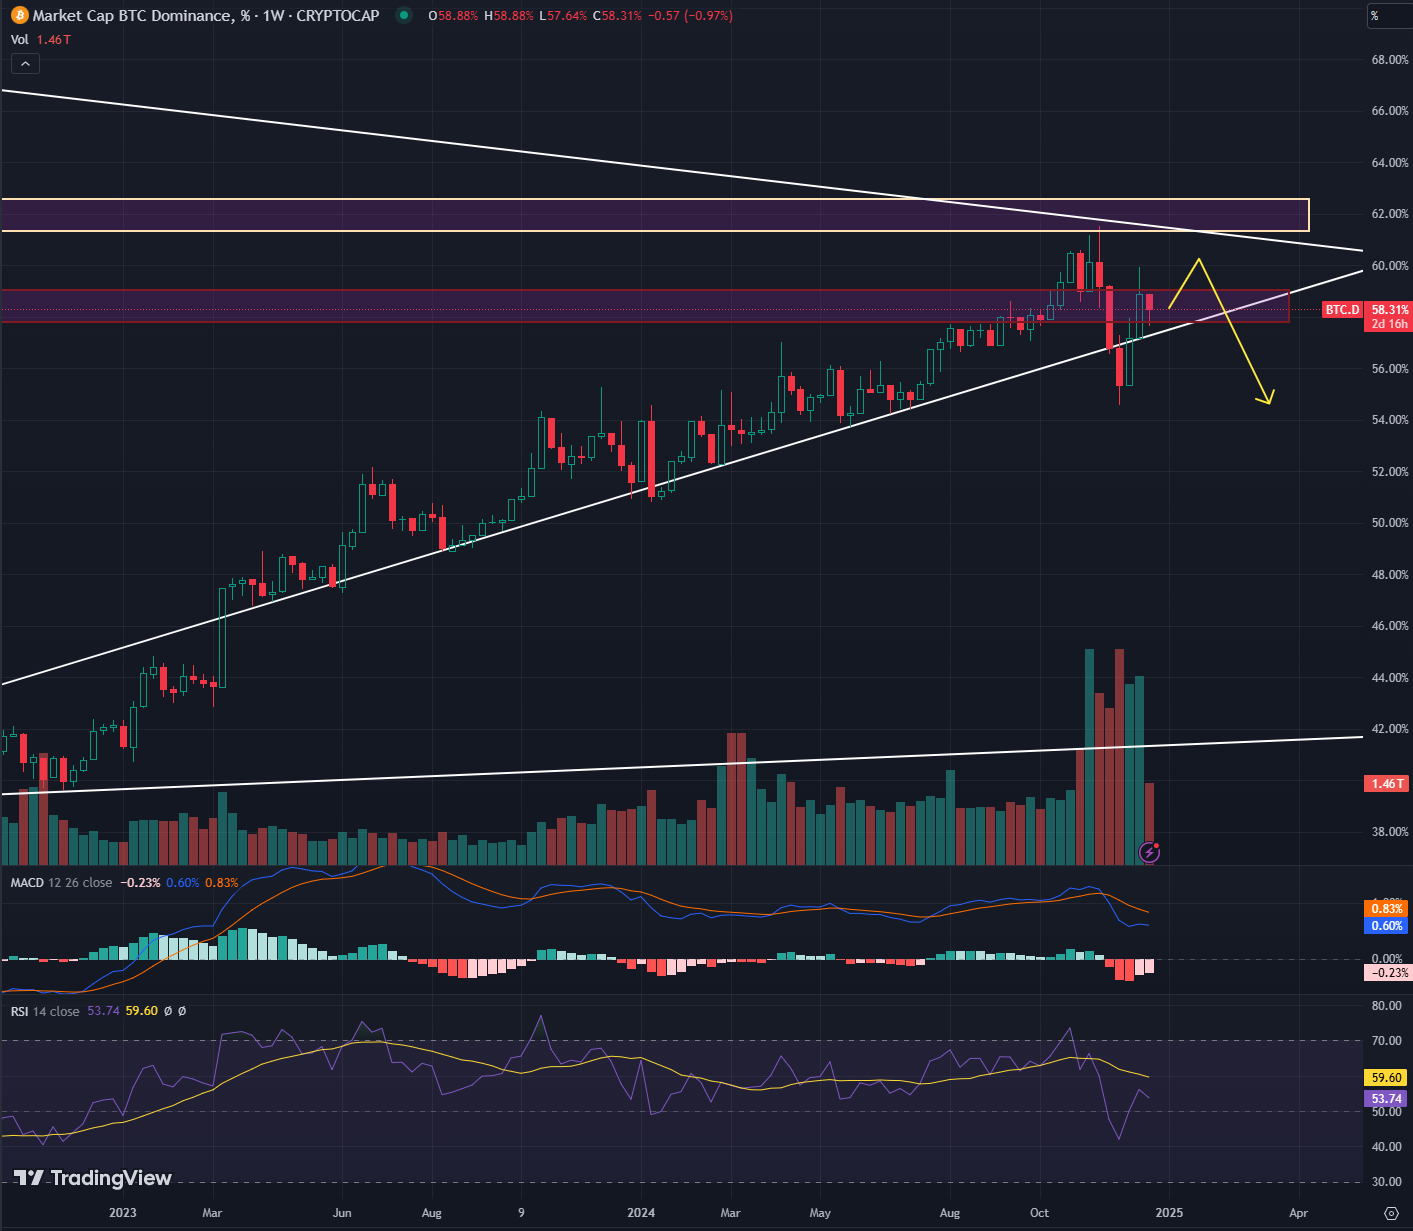
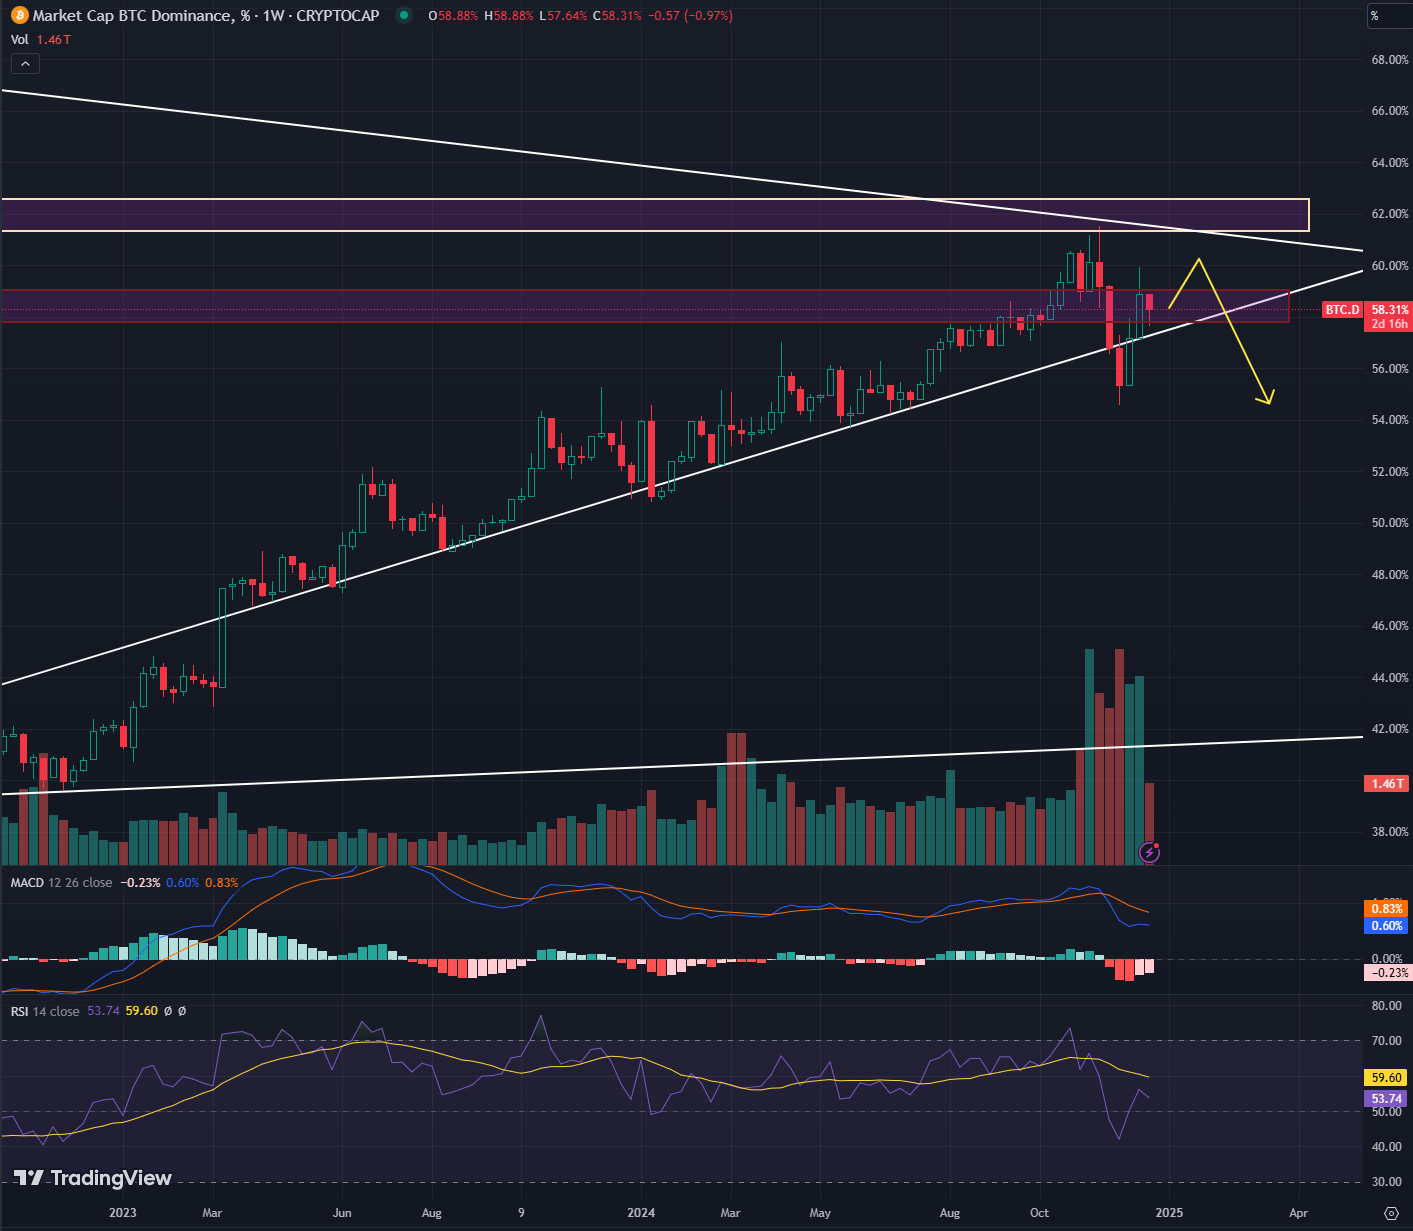
  • BTC's market share has dropped from 59.92% to 58.07% . Funds have gradually flowed out of BTC and dispersed into the altcoin sector.
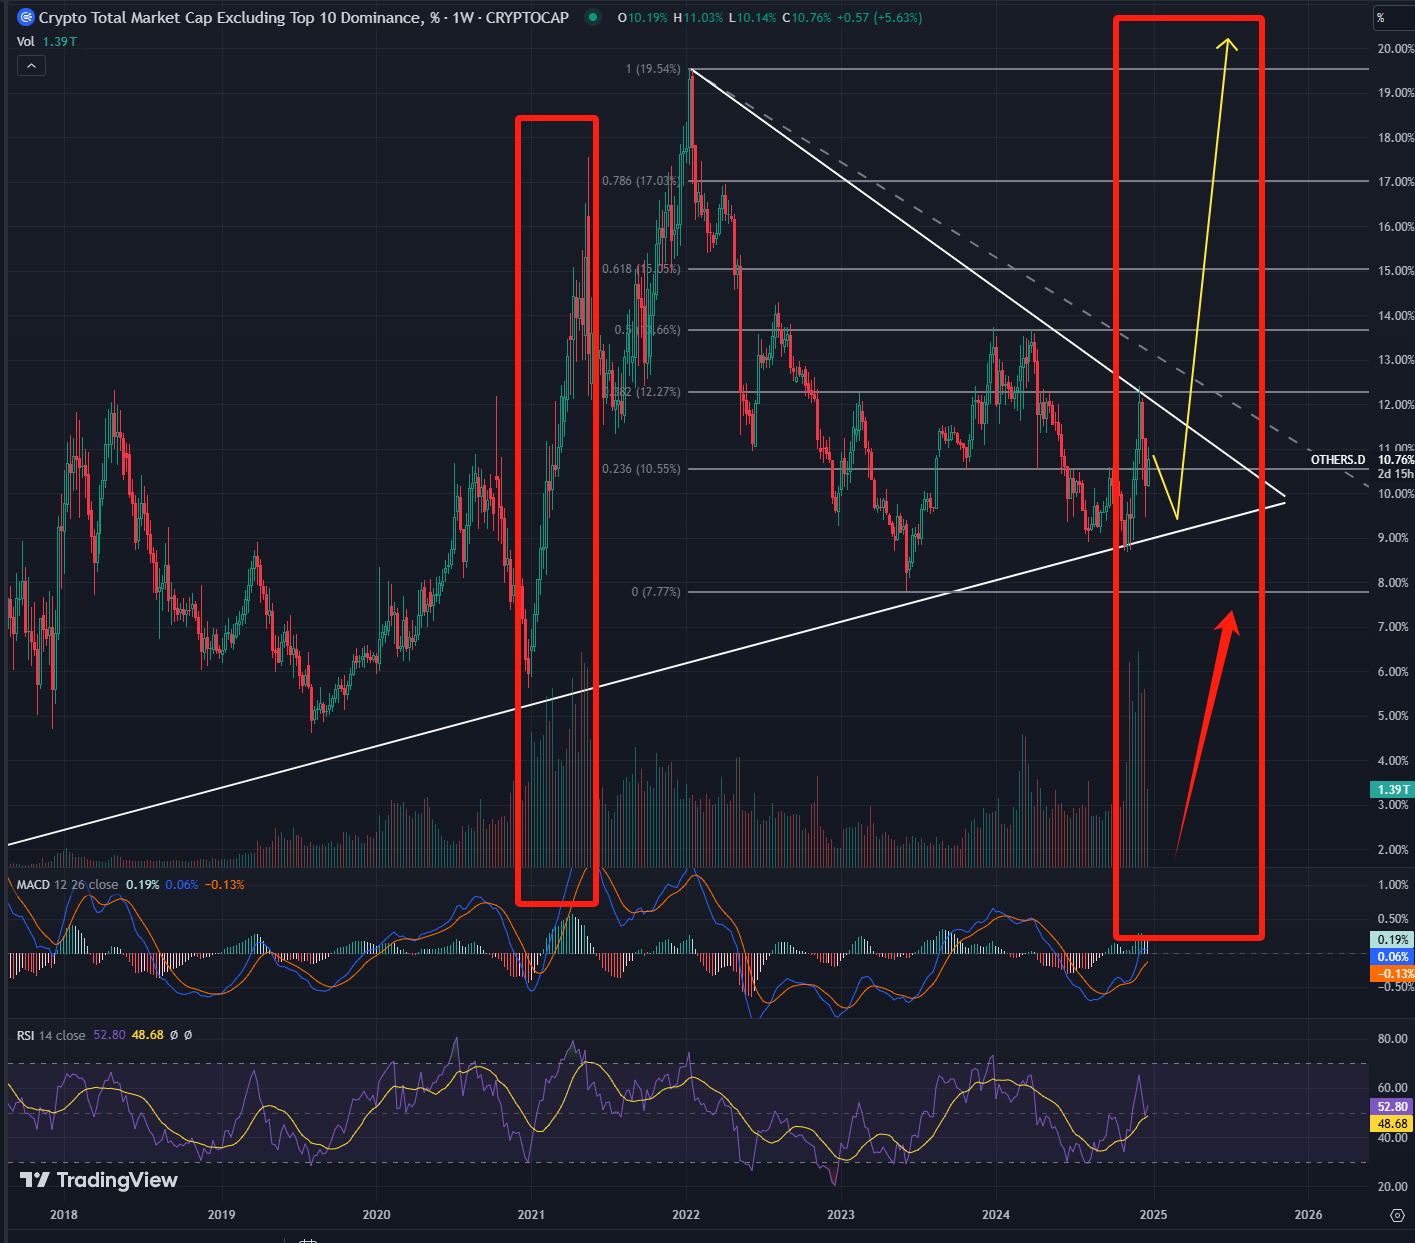
  • The altcoin market is close to breaking out: the altcoin market share (OTHERS.D) is oscillating at the end of the cyclical triangle. Combined with the historical cycle, the altcoin bull market may be about to begin.

5. The witching day effect and market volatility

  • High volatility: Option liquidations were triggered around Witch Day, and BTC trading volume rebounded to $19.25 billion in the short term. Directional breakthroughs still need to observe key support ($92,000).
  • Fund reallocation: After the witching day, short-term funds may flow to high-risk assets (altcoins), further reducing the share of BTC.

6. Outlook for next week

  • Key support: BTC needs to hold $92,000 . If there is no improvement in capital inflows, the market adjustment may be exacerbated.
  • Hot topic: Layer2 and DeFi sectors are expected to attract funds, and the altcoin market may usher in short-term rotation opportunities.

Macro

1. Positive factors: Potential bullish signals supporting the cryptocurrency market

Positive factors: Economic data exceeded expectations

  1. Service industry and consumption data are impressive

    • The preliminary value of the service industry PMI is 58.5 : indicating economic expansion, and the active service industry may boost overall economic confidence.
    • Retail sales monthly rate +0.7% : Strong consumption data shows strong consumer confidence.
    • Real GDP annualized quarterly rate +3.1%, personal consumption expenditure +3.7% : the economic growth rate is strong, and household consumption plays a significant supporting role in economic growth.
    • Leading indicator monthly rate +0.3% : Increased expectations for economic growth will help improve market sentiment.

    Data Analysis:

    • Strong economic growth could boost risk appetite, but it could also heighten expectations of a tightening Fed, which could have a dual impact on Bitcoin prices.
    • In the short term, optimistic economic data may inject confidence into the market, especially when Bitcoin is seen as a risky asset, this sentiment is good for its price.
  2. Labor market is strong

    • Initial jobless claims are stable (around 220k) : The labor market remains strong.
    • Stable employment data eases concerns about a recession, which helps support Bitcoin's risk asset logic.

2. Negative factors: Economic data is lower than expected

  1. Manufacturing PMI weak
    • The initial value of manufacturing PMI is 48.3 : a signal of shrinkage in the manufacturing industry, which may affect overall economic expectations.
    • As a barometer of the economy, weakness in the manufacturing sector could undermine investor confidence.
  2. Housing market and durable goods orders underperformed
    • The sluggish new housing starts and sales data reflect that the real estate market is still affected by high interest rates.
    • Durable goods orders monthly rate -1.1% : Business investment intentions declined, which may indicate weaker economic activity in the future.
  3. Consumer confidence falls
    • The Conference Board Consumer Confidence Index is 104.7 : lower than market expectations, which may weaken consumption-driven growth expectations.
    • Lack of consumer confidence will suppress market risk appetite and may be unfavorable for assets such as Bitcoin.

3. The profound impact of the witching day effect on the crypto market

December 27, 2024 is the last "Witching Day" (option and contract expiration date) of this year. The expiration of options and contracts has a significant impact on the short-term volatility and long-term trend of the market. The following is an analysis of the witching day effect combined with macroeconomic data:

1. Short-term volatility: high volatility and directional choices

  • Key data : According to Deribit data, nearly $20 billion in Bitcoin and Ethereum options expired on Friday, accounting for nearly 50% of the total open interest.
  • Potential impact :
    • High volatility : The arrival of witching day usually triggers a sharp increase in market volatility, especially when the market is close to a key price range. For example, BTC is currently oscillating in the key range of $95,000-$100,000 . If the price breaks through, it may trigger a chain reaction (such as liquidation triggers or a surge in trading volume).
    • Gamma suppression and breakthrough : A large number of options are concentrated on the key strike prices of $95,000-$100,000 and $105,000 . After the options expire, the market may experience a directional breakthrough.

2. Investor Behavior and Fund Flows

  • Profit-taking pressure : Large-scale option expiration may lead to profit-taking in the short term, especially in the current lack of strong capital inflows in the market (such as the slowdown in the issuance of ETFs and stablecoins).
  • Contract market liquidation effect : If the price breaks through a key support or resistance level, it will trigger liquidation behavior in the contract market, further amplifying the volatility.

3. Guidance from long-term trends

  • Market structure adjustment : With the end of the annual witching day, the market open interest may decline, providing the market with a breathing space. But at the same time, the dynamics of fund inflows and ETFs will become the key to the long-term trend of the market.
  • Shift in risk appetite : If BTC fails to break through key resistance in the future, the market may gradually shift to the altcoin sector (especially the Layer2 and DeFi sectors).

2. Industry Analysis

Interpretation of the impact of this week's on-chain data on BTC

Combined with this week’s on-chain data, the following analyzes the impact of these data on the BTC market from the aspects of capital flow , price indicators , and trading volume , and evaluates the key risks and opportunities in future trends.


2.1 Fund Flow

2.1.1 Stablecoin Fund Flow

Market Observation Weekly Report: Macro-driven and capital rotation, the crypto market is under pressure in the short term but optimistic in the long term

Market Observation Weekly Report: Macro-driven and capital rotation, the crypto market is under pressure in the short term but optimistic in the long term

Data interpretation:

  1. The trend of additional issuance is gradually slowing down :
    • The scale of additional issuance decreased significantly from the high issuance of 3.511 billion from November 29 to December 5 and 5.013 billion from December 6 to December 12 , to only 1.639 billion and -367 million in the two weeks from December 13 to December 27 respectively.
    • The average daily issuance volume also decreased, from a peak of 716 million (December 6-December 12) to -31 million in the most recent week.
  2. Insufficient capital inflow :
    • The average daily issuance volume fell below 200 million , indicating that the new liquidity in the market has significantly weakened. This may limit the rebound space of Bitcoin and the overall crypto market.
  3. The market may face pressures :
    • As the issuance of stablecoins slows down and market funding support weakens, investors should pay attention to potential selling pressure and the possible impact of price fluctuations.

2.1.2 ETF Fund Flow

Market Observation Weekly Report: Macro-driven and capital rotation, the crypto market is under pressure in the short term but optimistic in the long term

Market Observation Weekly Report: Macro-driven and capital rotation, the crypto market is under pressure in the short term but optimistic in the long term


Data interpretation:

1. Overall trend of ETF fund inflows:

  1. The fluctuation is obvious, and the overall decline is:
    • ETF fund inflows peaked in mid-November (3.335 billion from November 18 to November 22), and then gradually declined, especially in the two weeks from December 16 to December 27, when the weekly inflows were 520 million and -378 million respectively, which were at a low level.
    • There has been a continuous slowdown in the past two weeks : the inflows from December 16 to December 20 and from December 23 to December 27 were significantly lower than those in November and early December, reflecting the weakening enthusiasm of institutional funds to enter the market.
  2. ETF funds are closely related to BTC prices:
    • The peak of capital inflows in mid-November corresponded to a rapid rise in BTC prices (US$76,069 → US$93,018).
    • The gradual decline in capital inflows in December corresponded to a gradual decline in BTC prices (US$101,680 → US$94,876).

2. Comparison with the previous month's growth rate:

  1. Characteristics of violent fluctuations:
    • The highest single-week increase (+1.675 billion) occurred from November 18 to November 22 , indicating that institutional funds entered the market in a concentrated manner during the price breakthrough stage.
    • From November 25 to November 29 , the largest negative increase in a single week occurred (-3.473 billion), indicating that there was obvious profit-taking and capital outflow when prices were at a high level.
  2. Recent continuous decrease:
    • From December 16 to December 27, ETF funds fell for two consecutive weeks (-1.65 billion and -898 million), reflecting that market sentiment has become more cautious.

3. ETF inflows as a percentage of BTC circulation:

  1. High point and circulation ratio:
    • From November 18th to November 22nd , ETF fund inflows accounted for 0.181% of BTC circulation, reaching a peak.
    • In the past two weeks (December 16th - December 27th), the proportion was only 0.02255% and 0.021% , indicating that the market impact of the new funds has been significantly reduced.
  2. Fund inflows weaken support for prices:
    • The proportion of ETF fund inflows continues to decline, indicating that support for BTC prices has weakened; while the fund outflow phase puts greater downward pressure on the market.

Market impact and analysis:

1. Positive for BTC price:

  1. Peak stage of capital inflow:
    • The massive inflow of funds in November provided upward momentum for BTC, with institutional funds helping prices break through key resistance levels.
    • The continuity of ETF inflows strengthened market confidence at the time, pushing the BTC price above $100,000.

2. Negative factors for the market:

  1. Slowing capital inflows and price corrections:
    • The inflow of funds gradually decreased in December, and the price of BTC fell from the high of $101,680 in early December to $94,876 on December 27.
    • The slowdown in capital inflows reflects the market's divergence on the current price range, which may suppress price increases in the short term.
  2. Market volatility risk:
    • A decline in the proportion of ETF fund inflows may reduce market liquidity and increase price volatility.

3. Comprehensive impact analysis:

  1. Short-term volatility pressure:
    • Due to insufficient capital inflow and the price being in a period of adjustment, BTC may fluctuate around $94,000 in the short term, and we need to be vigilant about the loss of key support levels.
  2. Long-term support potential:
    • Despite the recent lack of capital inflows, ETF products remain attractive to institutional funds. If funds flow in again, it may become a key variable in driving up BTC prices.

2.1.3 Premium or discount in over-the-counter transactions

Market Observation Weekly Report: Macro-driven and capital rotation, the crypto market is under pressure in the short term but optimistic in the long term

1. USDT vs. USDC Premium

  • USDT premium is lower than USDC:
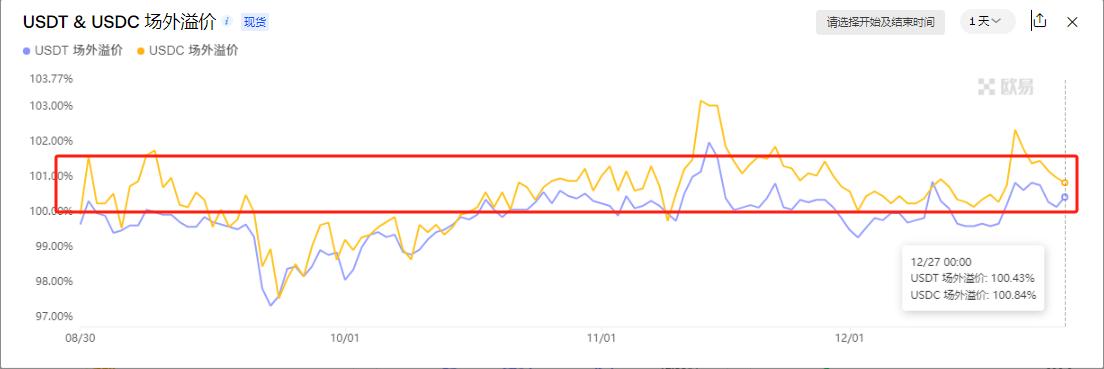
    • This week, the USDT premium (100.43%) is lower than the USDC premium (100.84%), but USDT is on an upward trend and USDC is on a downward trend, which may show that USDT has an advantage in short-term capital flows.

2. Short-term capital flow trends

  • USDT rebounds:
    • The rebound in premium indicates that USDT is more supported by market trading demand, which may reflect that more funds are flowing into the crypto market through USDT.
    • The witching day effect : The liquidation on December 27th pushed up short-term market activity and increased demand for USDT.
    • Safe-haven demand : The recent volatility in BTC prices (in the $93,000-96,000 range) may prompt investors to hedge against short-term volatility by holding USDT positions.
  • USDC Demand is Weak:
    • The decline in premium may indicate that institutional funding demand for USDC has slowed down, but it is still in the premium range above 100%, indicating that the overall market demand for stablecoins remains strong.
    • Institutional preference : USDC is generally regarded as a more institutionally-oriented stablecoin, and the decline in premium may reflect the recent weakening trading enthusiasm of institutional funds.
    • Pressure to reduce holdings : Some institutions may reallocate stablecoins at the end of the year, resulting in a decline in demand for USDC.

2.2 Related price indicators

2.2.1 Cryptocurrency Market Value and BTC Market Share

Market Observation Weekly Report: Macro-driven and capital rotation, the crypto market is under pressure in the short term but optimistic in the long term

Market Observation Weekly Report: Macro-driven and capital rotation, the crypto market is under pressure in the short term but optimistic in the long term


Statistics

  1. Total cryptocurrency market capitalization
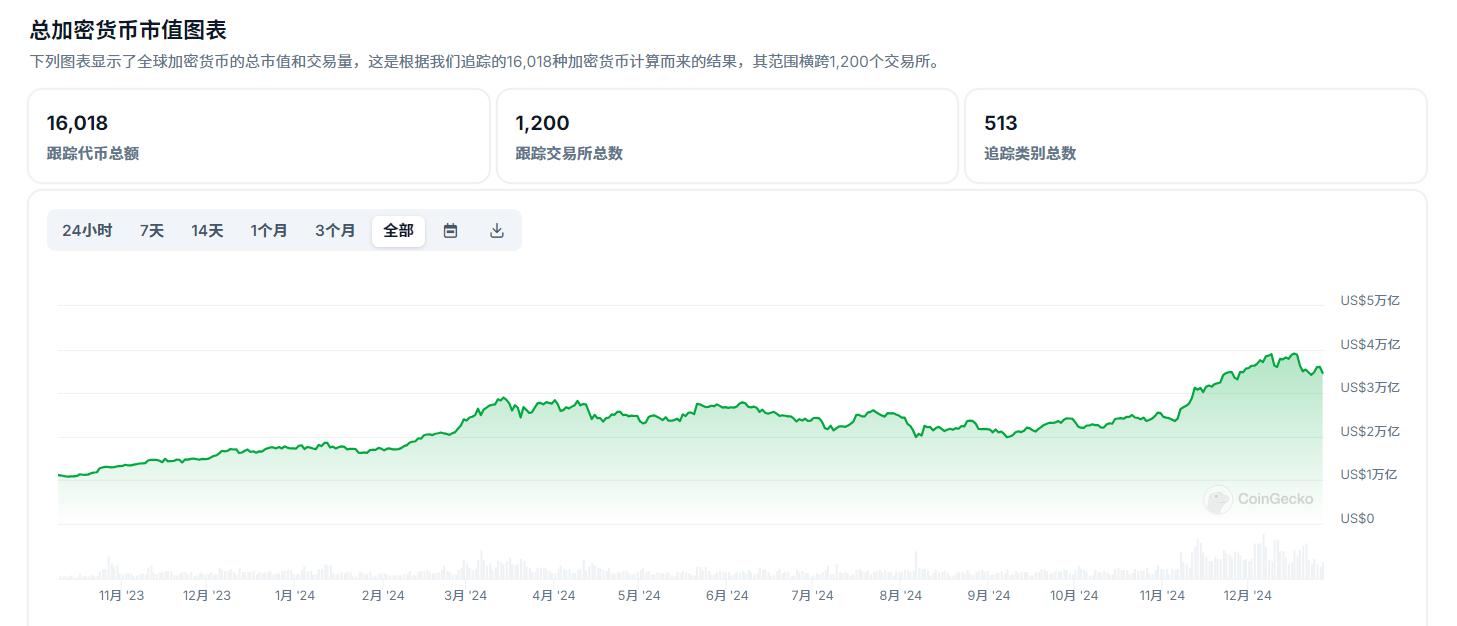
    • December 20 (beginning of week): $3.5 trillion
    • December 27 (weekend): $3.46 trillion
    • Changes this week: Total market value fell by $40 billion , a weekly decline of about 1.14%
  2. BTC market share
    • December 20 (beginning of the week): 59.92%
    • December 27 (weekend): 58.07%
    • Changes this week: BTC market share -1.85%

Data analysis

1. The total market value of cryptocurrencies has declined

  • Market sentiment tends to be cautious:
    • The slight decline in the total market value of the crypto market this week was mainly affected by the following factors:
      • Option expiration date effect: December 27 is the witching day for options in the crypto market, with BTC and ETH options with a notional value of nearly US$20 billion expiring. The market fluctuates greatly during this period, and investors are more inclined to reduce their positions and wait and see.
      • Macroeconomic environment factors: The Fed's continued hawkish tone has caused the market to remain concerned about future liquidity prospects. At the same time, economic data has not fully confirmed expectations of easing, which has put some pressure on risky assets.
      • Insufficient trading volume: The issuance of stablecoins has slowed down, and the inflow of funds into the crypto market this week has been limited. In addition, trading volumes are usually low before and after holidays, which limits the further upside of the market.
  • Multi-asset sectors under pressure:
    • This week, altcoins and small-cap projects generally performed weaker than BTC, causing the total market value of the crypto market to decline. More funds flowed to mainstream assets such as BTC and ETH for risk aversion, indicating that investors' interest in high-risk assets has weakened.

2. BTC market share declines

  • “Funds flowing out of BTC” phenomenon: This week, BTC’s market share dropped from 59.92% to 58.07%, indicating that market funds are flowing out of BTC in the short term and turning to other assets . This trend may be related to the following factors:
  1. Market reconfiguration after witch hunt:
    • After the witching day on December 27, short-term speculative funds reduced their concentrated bets on BTC, and some funds may be diversified into high-risk, high-return assets (such as small-cap tokens or altcoins).

2.2.2 BTC overall transaction volume

Market Observation Weekly Report: Macro-driven and capital rotation, the crypto market is under pressure in the short term but optimistic in the long term

Market Observation Weekly Report: Macro-driven and capital rotation, the crypto market is under pressure in the short term but optimistic in the long term

Overall trading volume changes this week:

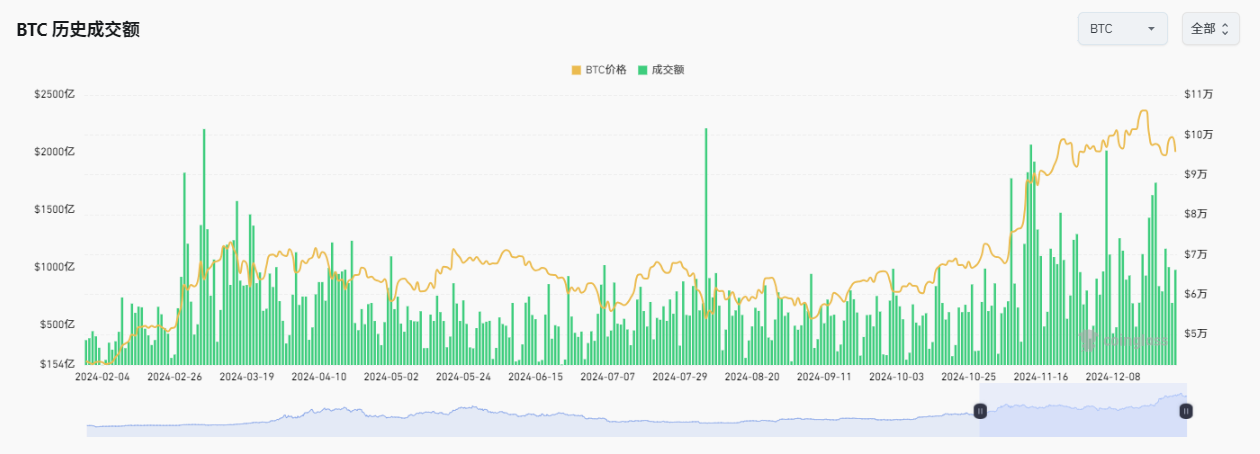
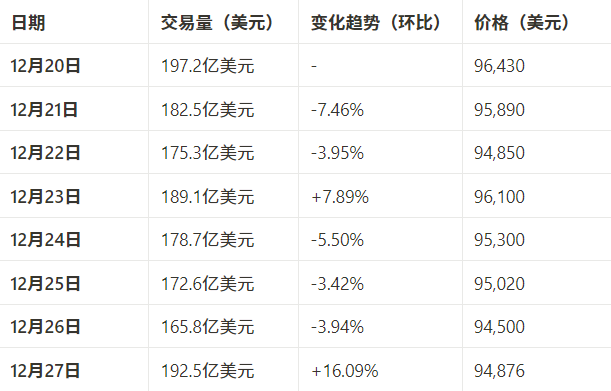
  • The total BTC trading volume this week was approximately $145.37 billion .
  • Week-on-week: down about 8.36% from last week (US$158.64 billion).
  • Average daily trading volume: $18.17 billion , lower than the daily average of the previous two weeks (about $21 billion).

2. Data analysis: Trends in trading volume changes

1. Overall trend: trading volume shows a "decline-rebound" pattern

  1. Early week to Christmas period (December 20-December 25): Trading volume decreases
    • Gradually declining: In the first five days of this week, BTC trading volume continued to shrink, with a cumulative decline of about 15.9% .
    • reason:
      • Cautious market sentiment: As the witching day on December 27 approaches, investors generally wait and see, reduce the frequency of operations, and the market liquidity is insufficient.
        • Holiday effect: During the Christmas holidays, market trading activity generally declined, and trading volume shrank significantly.
  2. Around Witch Day (December 26-December 27): Trading volume picks up
    • Short-term rebound: On December 27, trading volume reached US$19.25 billion , a significant increase of 16.09% from December 26, returning to pre-Christmas levels.
    • reason:
      • Wizarding Day Liquidation Effect: December 27th was the witching day for BTC options, with options with a notional value of nearly $20 billion expiring, leading to increased market volatility and a significant increase in trading volume.
      • Short-term speculation: The sharp price fluctuations after the witch day attracted some short-term funds to enter the market, driving the trading volume to rebound.

2. Relationship between trading volume changes and prices

  1. Declining volumes and weak prices
    • Price weakness phase: From December 20 to December 26, the BTC price slowly fell from $96,430 to $94,500 , a cumulative drop of about 2% .
    • Decreased trading volume: During this period, trading volume gradually shrank, market buying power was insufficient, and price support was limited.
  2. Trading volume rebounds and prices stabilize
    • Rebound after the witch hunt: Trading volume rebounded rapidly on December 27, forming a positive linkage with the short-term price rebound to US$94,876 , indicating that funds began to tentatively flow back into the market.
    • Increased volatility: The recovery in trading volume after the witch day is more related to option expiration and may not form sustainable upward momentum.

3. Compare previous trading volumes

  • Shrinking from historical peaks:
    • In mid-November, when the BTC price exceeded $100,000, the average daily trading volume exceeded $30 billion . The current average daily trading volume is only $18.17 billion , indicating a significant decline in market activity.
  • Insufficient volume limits the price:
    • The current lack of trading volume directly affects the rising potential of BTC prices, indicating that the market lacks strong incremental funds.

Future focus areas:

  1. Signal of recovery in ETF inflows : It is necessary to observe whether the weekly inflow of ETFs can recover to more than 2 billion to determine whether institutional funds have regained confidence.
  2. Changes in market sentiment : Combined with BTC trading volume and stablecoin issuance data, the overall liquidity level of market funds is analyzed. If stablecoin issuance continues to be sluggish, the market may be further pressured, especially BTC's key support level may face testing.
  3. Key Price Support : Focus on the support strength of BTC in the $92,000-94,000 range.

Aeolus Wheel

Summary and outlook for this week

1. Short-term summary

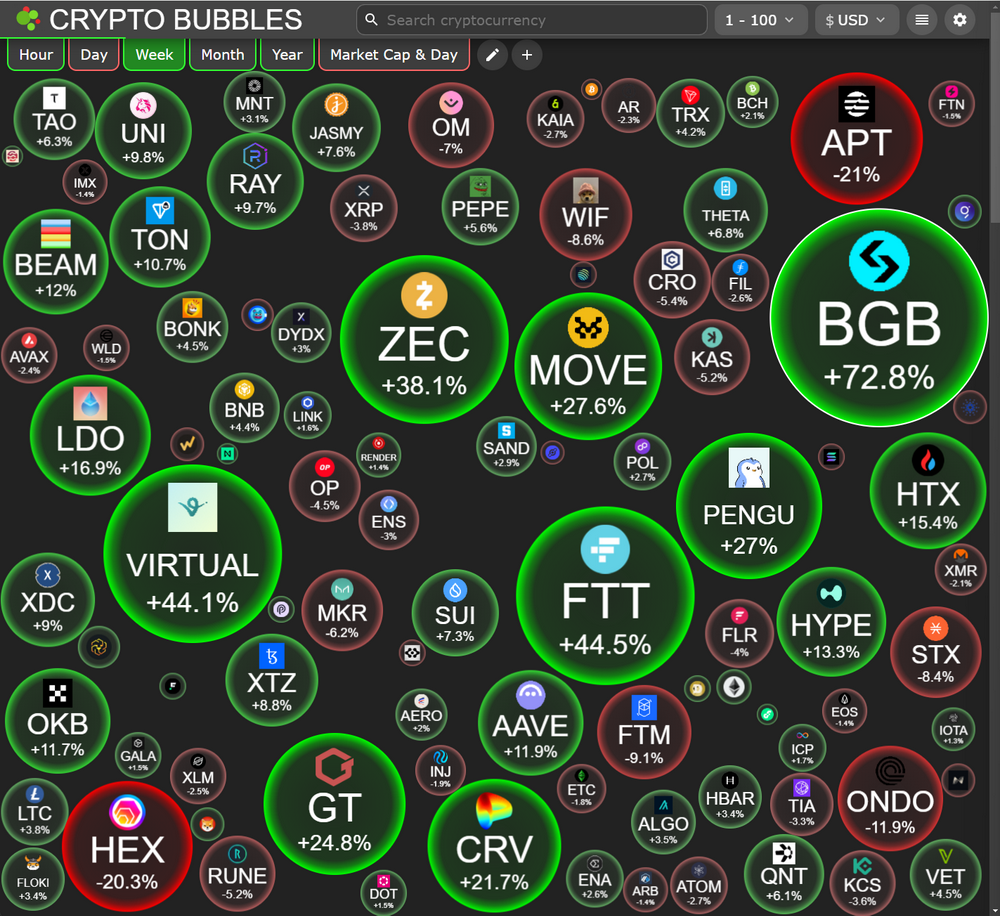
  • Altcoin Rebound : The altcoin market has rebounded this week, with some tokens performing well.
  • Capital outflow pressure : the scale of net outflow on the 30th expanded, while the speed of net outflow on the 7th slowed down.
  • BTC market share and USDT market share : There is severe bargaining at key points and may continue to rise in the short term.

2. Mid- to long-term outlook

  • Market share of altcoins : The market share of all tokens except the top 10 is about to end the oscillation triangle. Combined with the laws of historical cycles, we are optimistic about the return of the altcoin bull market in the medium term.

3. Risks and recommendations

  • Risk : If BTC falls below 90,000, the altcoin market may deteriorate further.
  • Strategic advice : Pay attention to the BSC ecosystem, which may recover after receiving support from Binance

Combining this week's macroeconomic indicators and market data analysis, the altcoin market is experiencing continuous adjustments and capital outflow pressure. The following is an analysis of this week's altcoin market performance from multiple dimensions, including altcoin season indicators, capital flows, BTC market share, OTHERS market share, and USDT market share , and looks forward to possible future development paths.

Cottage Season Indicators


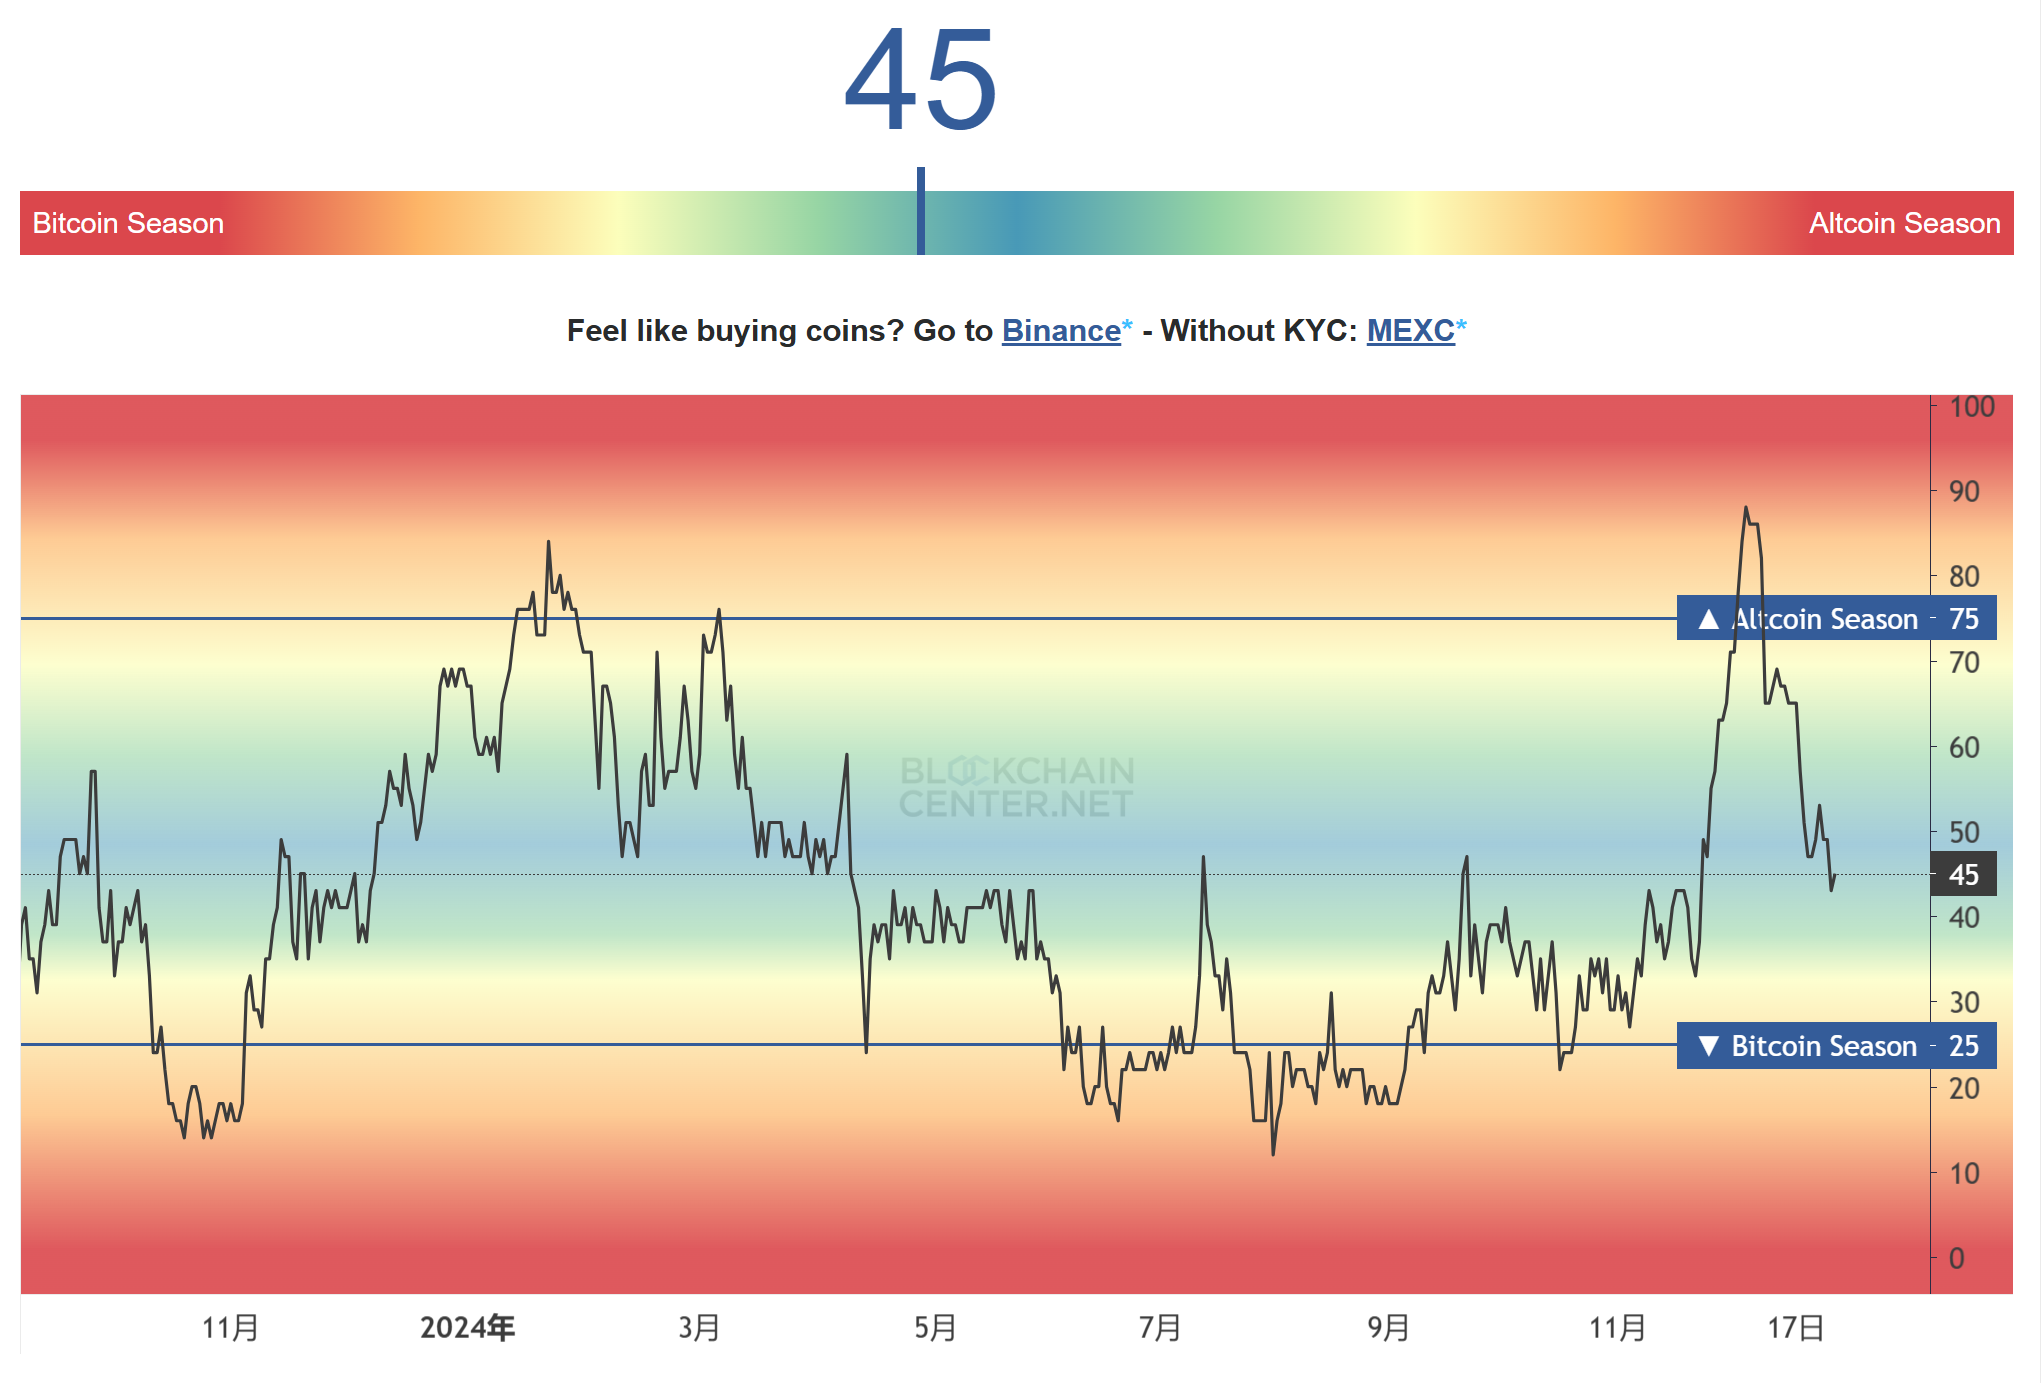
This Friday, the Shanzhai Index fell from 47 last week to 45, and the overall decline of the index slowed down.

Market Observation Weekly Report: Macro-driven and capital rotation, the crypto market is under pressure in the short term but optimistic in the long term

The good news is that many altcoins have rebounded this week, and in the short term many altcoins may have bottomed out. However, if BTC loses 90,000, it may cause a collective pullback of altcoins again. Please be sure to pay attention to the risks.

Market Observation Weekly Report: Macro-driven and capital rotation, the crypto market is under pressure in the short term but optimistic in the long term

Inflow of copycats


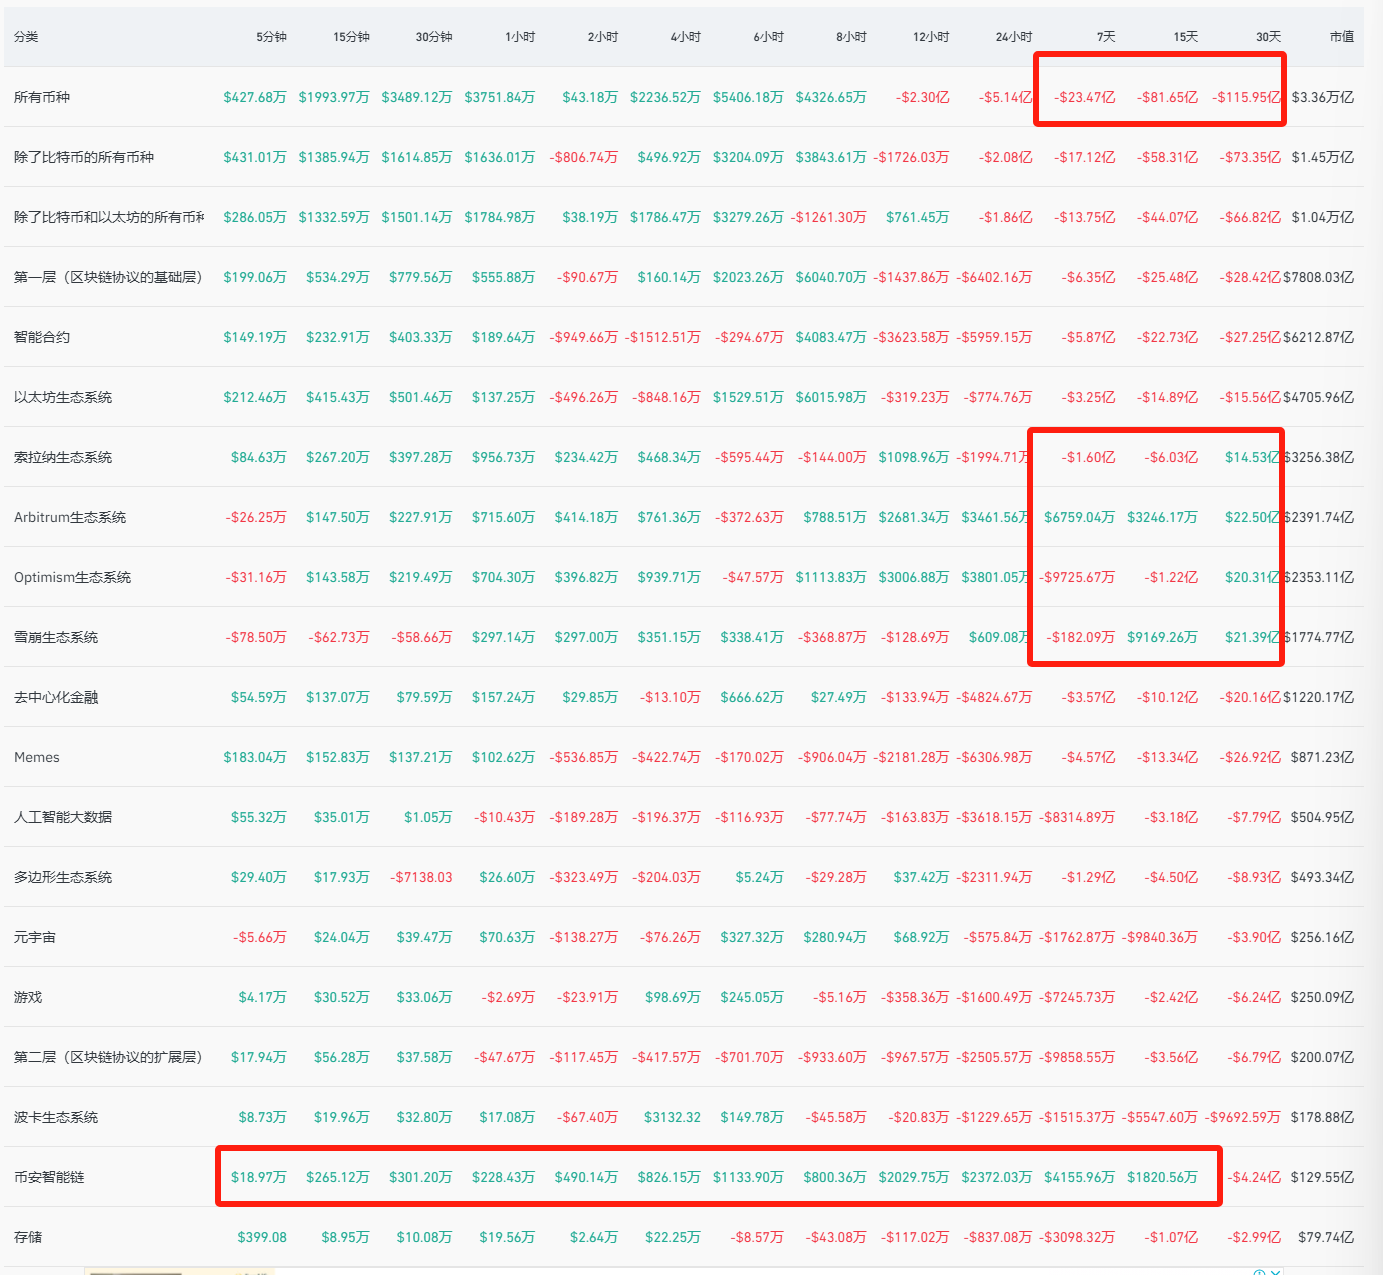
The slight rebound of the altcoin this week was not well reflected in the inflow data of each sector, but fortunately, the net outflow of all currencies this week was US$2.347 billion, a decrease of 48% from last week, but the overall 30-day net outflow is still increasing, reaching US$11.6 billion.

Market Observation Weekly Report: Macro-driven and capital rotation, the crypto market is under pressure in the short term but optimistic in the long term

On the monthly chart, among all sectors, only the SOL, ARB, OP, and AVAX ecosystems we mentioned in recent weeks maintained net inflows. On the weekly chart, only the ARB, AVAX, and BSC ecosystems had net inflows this week.

It is worth noting that the BSC ecosystem has gradually shown signs of recovery, and the 15-day inflow level has returned to normal, but there is still a huge outflow gap on the monthly line that needs to be slowly filled.

Market Observation Weekly Report: Macro-driven and capital rotation, the crypto market is under pressure in the short term but optimistic in the long term

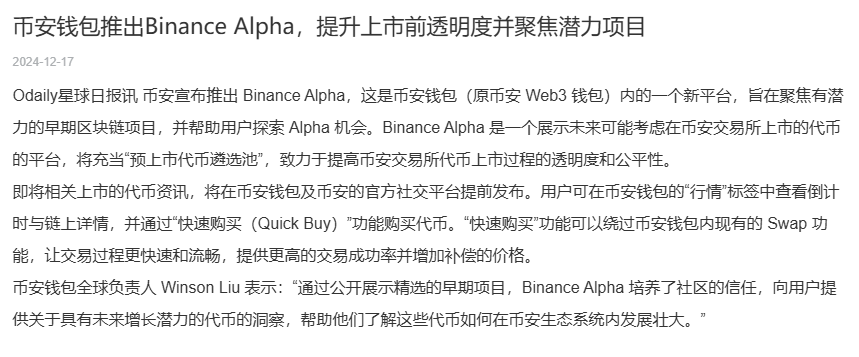
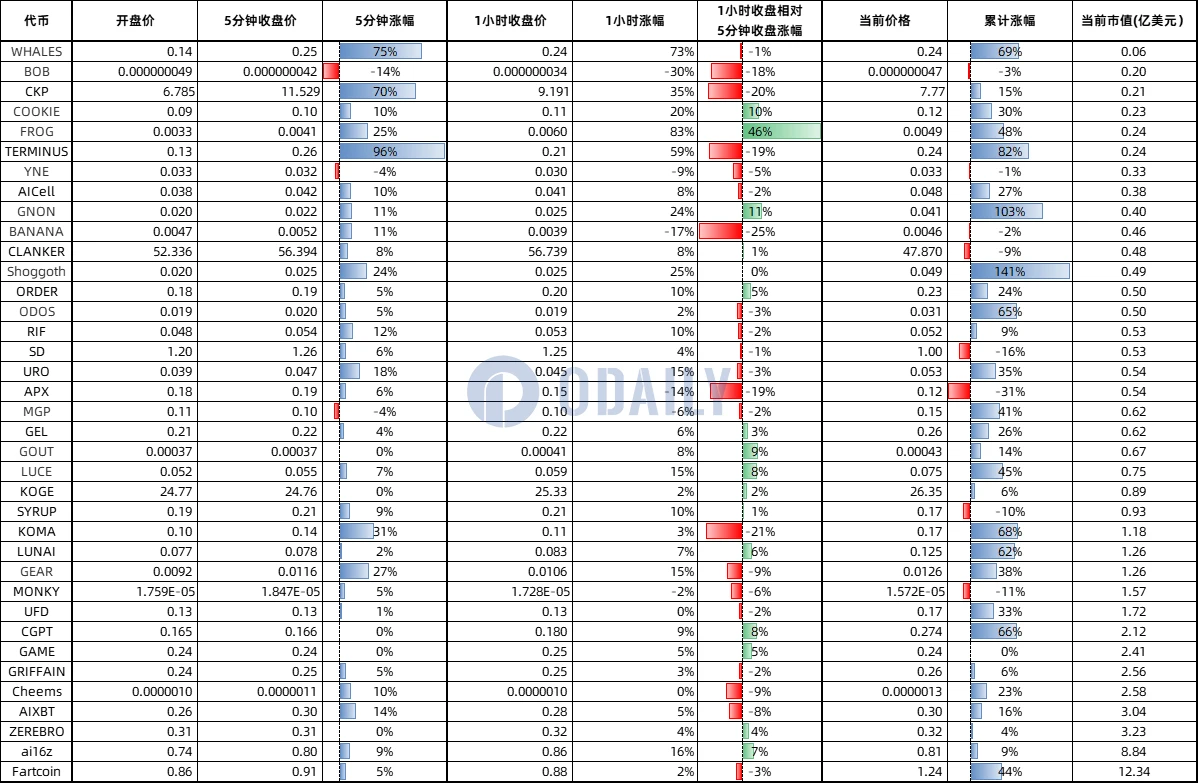
We speculate that this short-term recovery is due to the driving effect of Binance Alpha, which was launched by Binance last Tuesday, December 17. The Alpha pool will list several potential tokens in each phase, among which BSC ecological tokens will account for the majority. Therefore, market funds may flow into BSC from a speculative perspective to ambush some potential targets on the left side.

According to ODAILY's existing research, the wealth effect of the Alpha pool is still focused on the ultra-short term, but we believe that in the medium term, combined with Binance's support, the BSC ecosystem is still expected to recover significantly. We have also previously laid out several BSC targets and will continue to pay attention.

Market Observation Weekly Report: Macro-driven and capital rotation, the crypto market is under pressure in the short term but optimistic in the long term

BTC market share (ratio, growth rate)


In terms of BTC market share, we are still oscillating in the resistance range mentioned last week on the weekly chart, and our conclusion remains unchanged. BTC's strong position is about to break near the end of the triangle and usher in the arrival of the altcoin season. However, we are not sure whether the upper track of the triangle will be tested or directly broken, and we need to pay attention to the strength of BTC in the short term.

Market Observation Weekly Report: Macro-driven and capital rotation, the crypto market is under pressure in the short term but optimistic in the long term

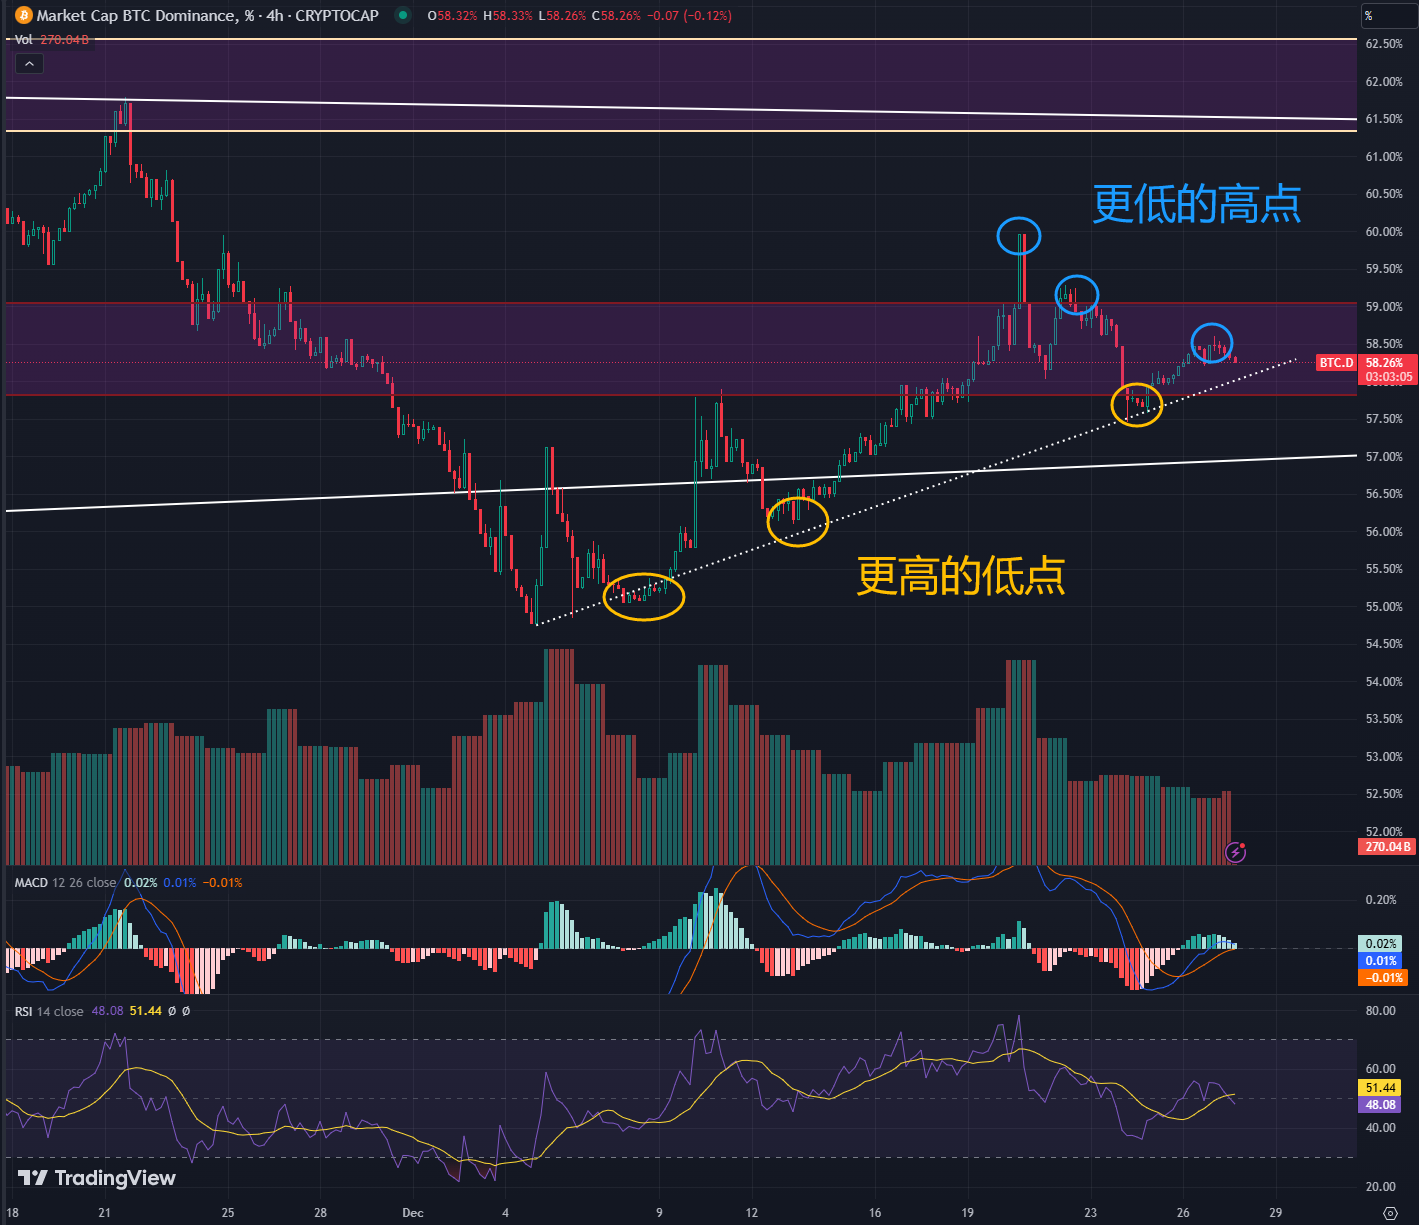
There is still some support at the 4h level. We have seen that BTC has established three higher lows in this strong phase, but it has quickly fallen back after breaking through the resistance range in the past few days and is about to test short-term support. In the case of generally weak cottages, we are more inclined to believe that BTC's market share will continue to be strong for some time.

Market Observation Weekly Report: Macro-driven and capital rotation, the crypto market is under pressure in the short term but optimistic in the long term

OTHERS.D


The total market capitalization and market share of tokens other than the top ten are still entangled at the end of the oscillation triangle. Combined with the cyclical laws and volume growth forms we mentioned last week, we are very close to the altcoin season, and the conclusion is consistent with last week.

Market Observation Weekly Report: Macro-driven and capital rotation, the crypto market is under pressure in the short term but optimistic in the long term

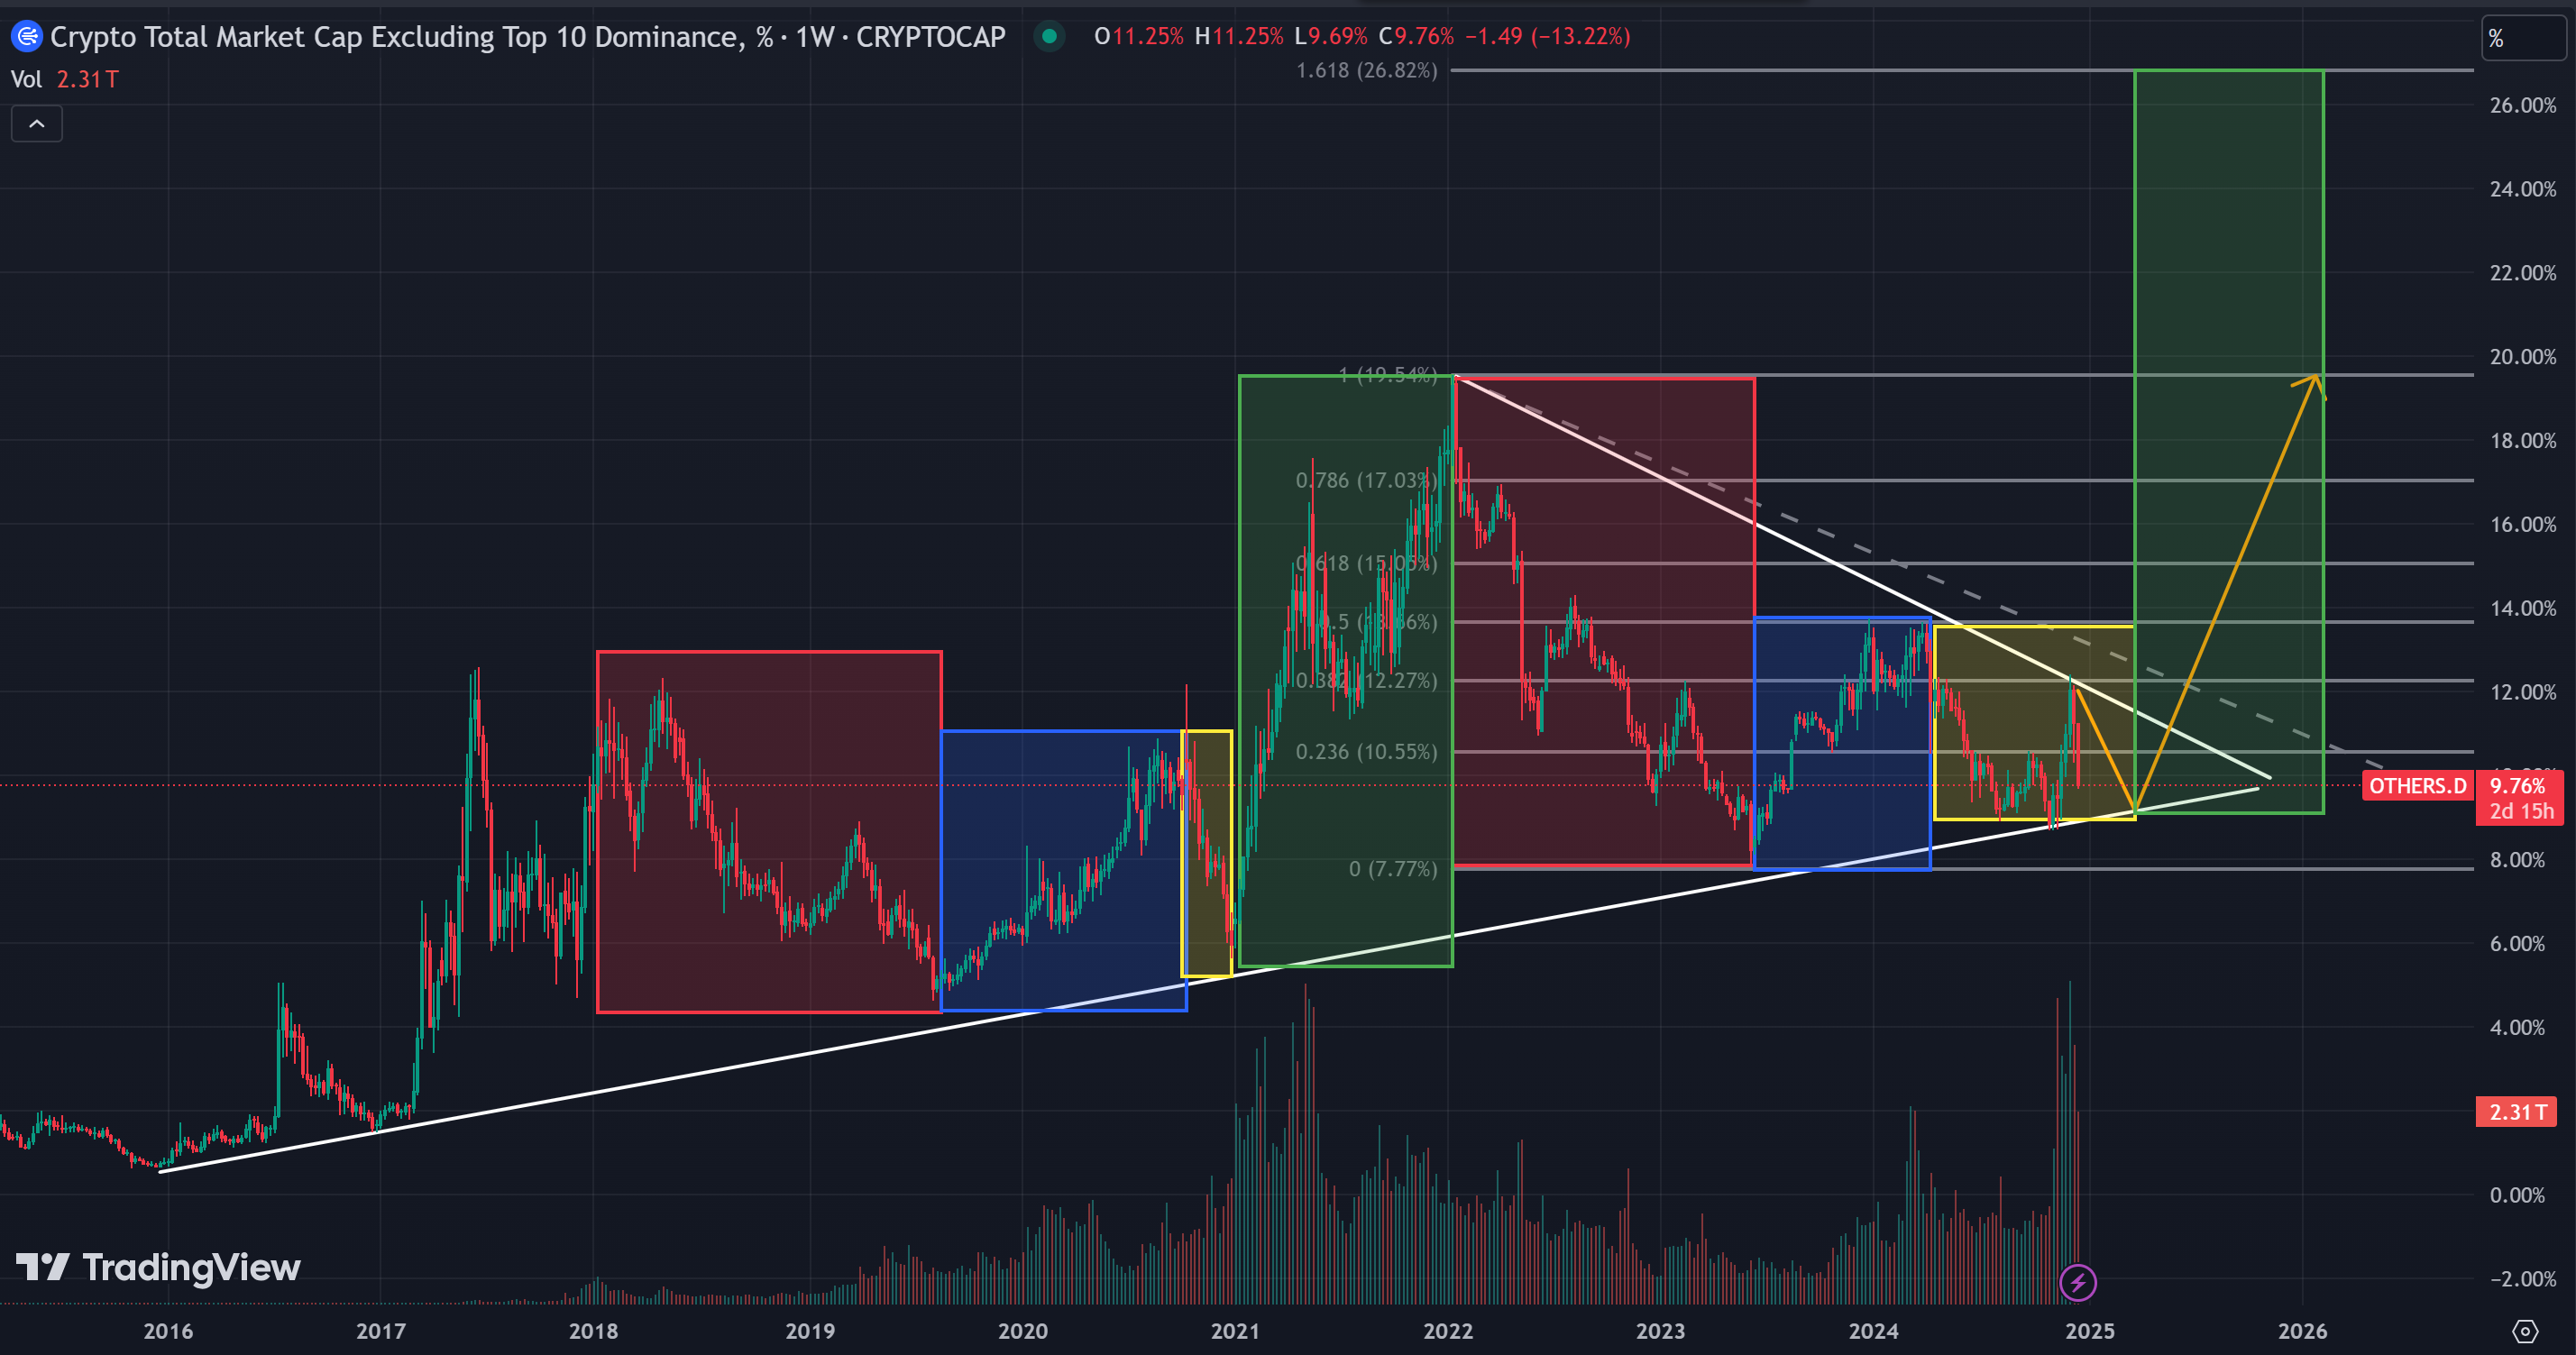
Summary of cycle rules:

Market Observation Weekly Report: Macro-driven and capital rotation, the crypto market is under pressure in the short term but optimistic in the long term

  • Red area: decline after the bull peak
  • Blue area: first rebound after bottoming out
  • Yellow area: After rebounding, it fell again, creating market panic
  • Green area: fake bull market, bull top range

It should be noted that since 2016, we have been continuously establishing higher lows and higher highs. Therefore, we are now in the yellow area and there is a high probability that we will enter a copycat bull market in the future, and OTHERS.D will quickly rise to a higher high range (Fibonacci 1~1.618 range).

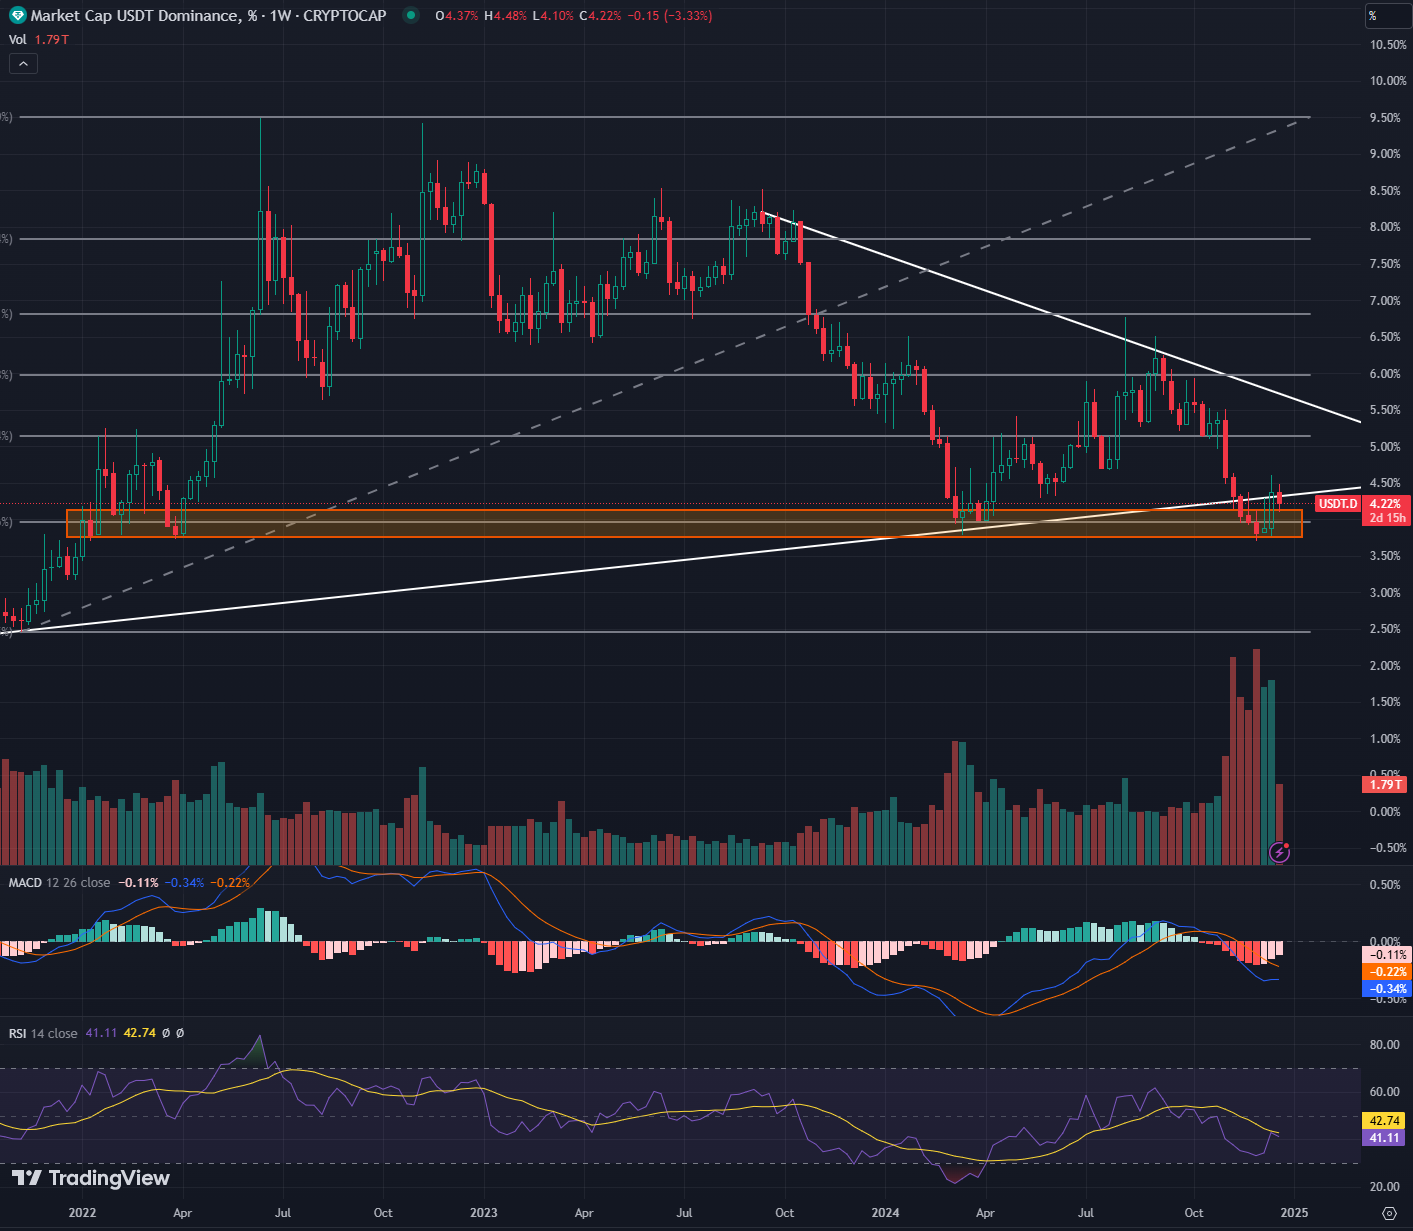
USDT Market Share


Finally, let’s take a look at the market share of USDT, which can also reflect the strength of the altcoin market.

Market Observation Weekly Report: Macro-driven and capital rotation, the crypto market is under pressure in the short term but optimistic in the long term

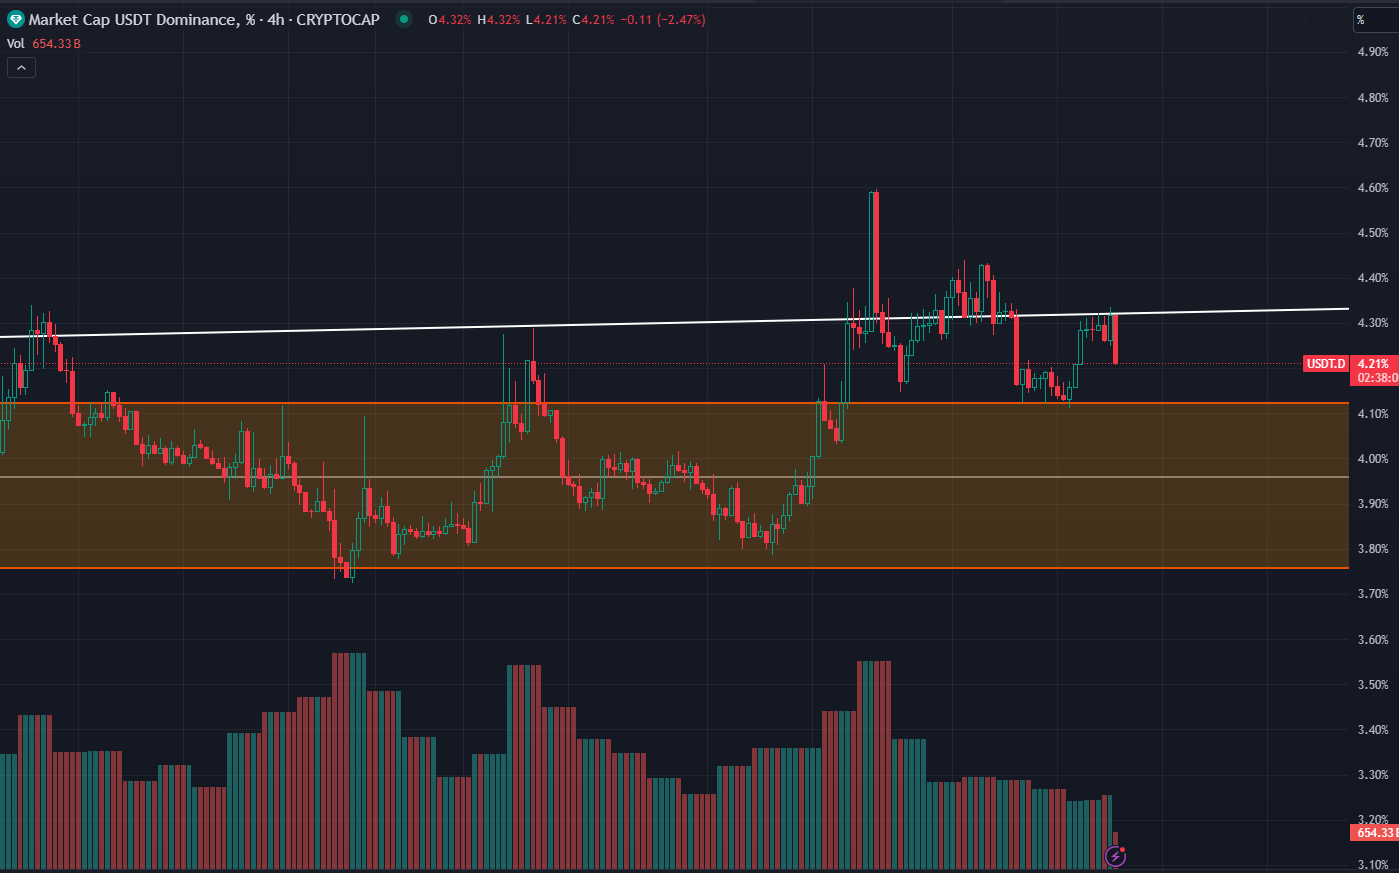
Similar to last week, this week USDT’s market share retreated to the long-term support line and has been fluctuating around the line.

Market Observation Weekly Report: Macro-driven and capital rotation, the crypto market is under pressure in the short term but optimistic in the long term

The 4-hour level is constantly testing the support line, which has been rejected many times, but it is still testing. Therefore, the attention to USDT's market share needs to be focused on the daily level or above to be clearer, and we will continue to pay attention to it later.

Special thanks

Creation is not easy. If you need to reprint or quote, please contact the author in advance for authorization or indicate the source. Thank you again for your support.

Written by: Sylvia / Jim / Mat / Cage / WolfDAO

Edited by: Punko / Nora

Thanks to the above partners for their outstanding contributions to this weekly report. This weekly report is published by WolfDAO for learning, communication, research or appreciation only.